
We recognise Aboriginal and Torres Strait Islanders as the sovereign Traditional Owners of Australia and thank them for their stewardship of this Country, its lands, waters and skies. We respectfully acknowledge their culture and customary practices, and pay respect to their Ancestors, Elders and future leaders.
For the first time, the State of the Environment report includes a strong Indigenous narrative across all 12 thematic chapters, a narrative crafted through recognising the leadership, collaboration and authorship of Indigenous Australians who continue their connection as Traditional Owners to their lands, waters and skies.
Click to view the State of the Environment report
On 28 March 2025 the government assumed a Caretaker role. Information on websites maintained by the Department of Climate Change, Energy, the Environment and Water will be published in accordance with the Guidance on Caretaker Conventions until after the conclusion of the caretaker period.
Due to technical issues, graphs, maps and tables are currently not displaying within the main content, however, are available via the chapter resources navigation bar. We are working on a solution to resolve the issue.
Graphs, maps and tables


EPBC Act = Environment Protection and Biodiversity Conservation Act 1999

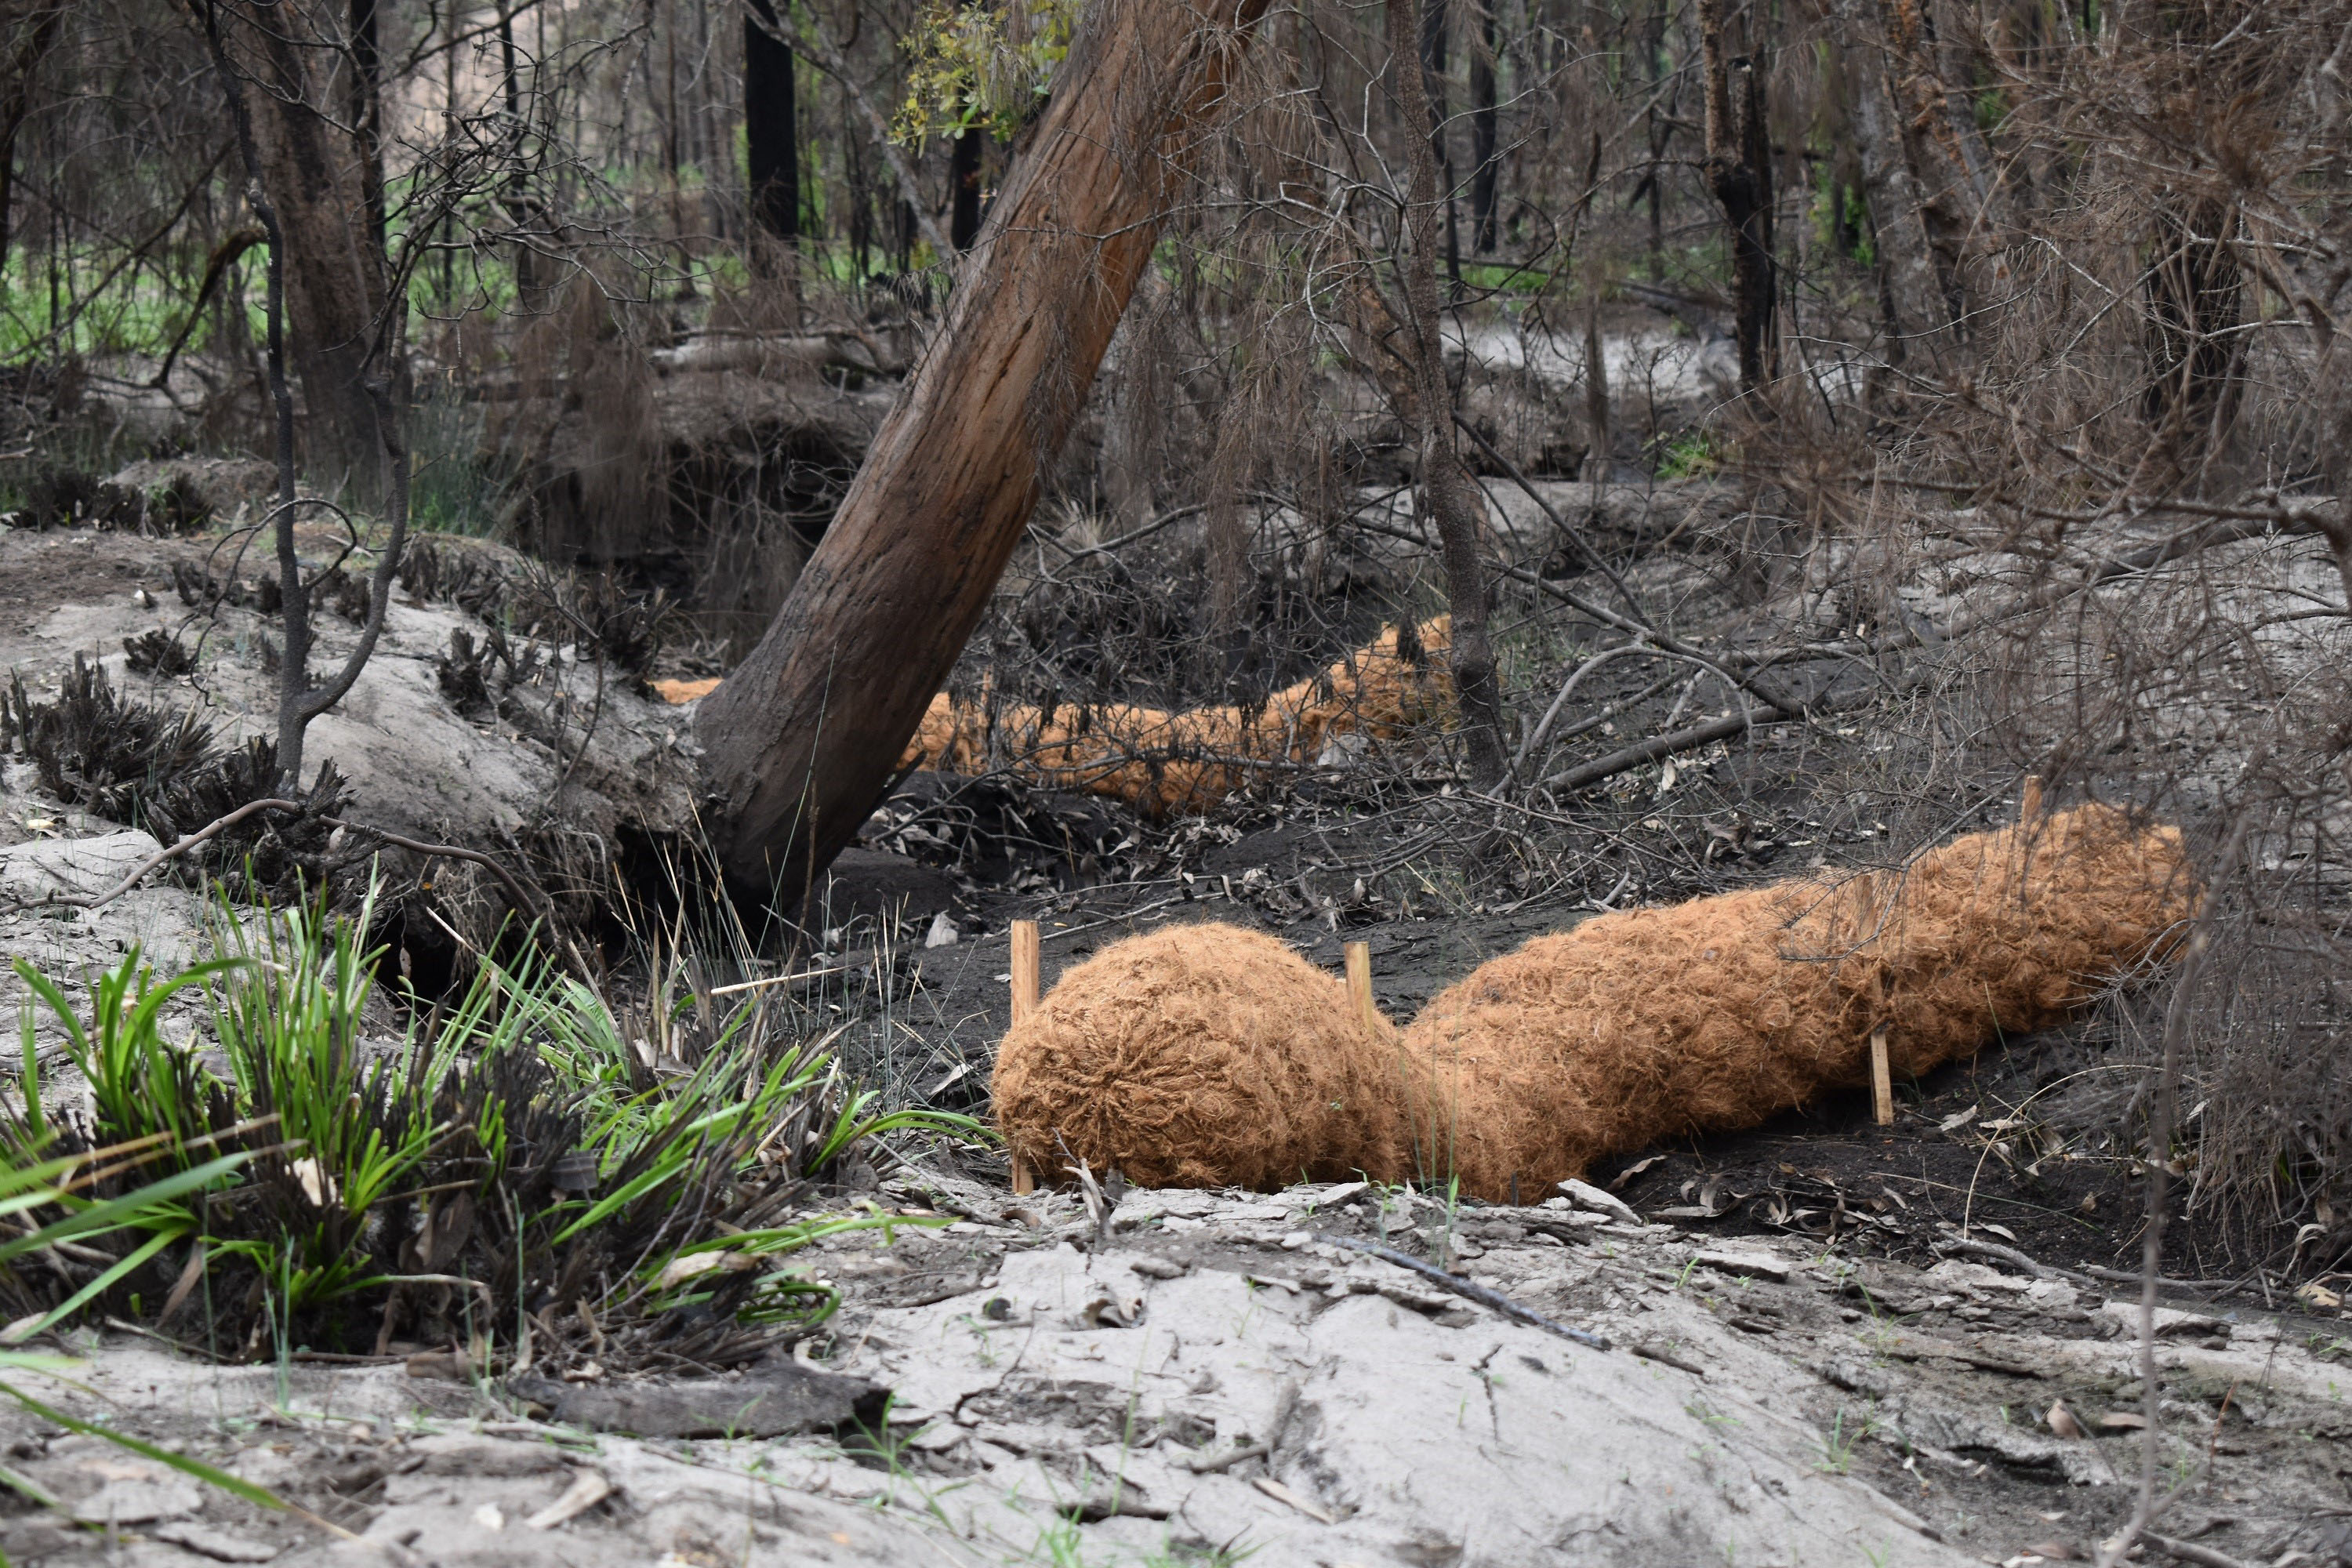
Photo: James Cornwell, Local Land Services, New South Wales

EPBC Act = Environment Protection and Biodiversity Conservation Act 1999
Source: Kearney et al. (2018a)
Reproduced with permission from Cambridge University Press

EPBC Act = Environment Protection and Biodiversity Conservation Act 1999
Notes:
- n = 1,533
- Each graph is scaled according to the number of taxa listed under the Environment Protection and Biodiversity Conservation Act 1999 as being affected by each threat category (e.g. Urban development). Each chart segment represents a subclass threat (e.g. Housing). The threat category ‘Geological events’ is not shown here because it impacts <20 species, and subclass threats that impact <5 taxa (e.g. Renewable energy) are not shown because they were too small to be displayed effectively.
- ‘Agriculture (other)’ includes land clearing, habitat fragmentation and/or habitat degradation.
Source: Reproduced with permission from Kearney et al. (2018b)

mm = millimetre
Source: Perry et al. (2021)

km2 = square kilometre; mm/yr = millimetres per year
Source: Perry et al. (2021)


Photo: Peter Hammond

Note: The number of species per location is indicated in parentheses.
Source: Soanes & Lentini (2019)