The CSIRO and the Australian Government Department of Agriculture, Water and the Environment (DAWE) have been collaborating on the development of the national Habitat Condition Assessment System (HCAS) since 2015. HCAS was developed to address the need for nationally consistent, landscape-wide, site-level estimates of habitat condition to inform the conservation of Australia’s wildlife and natural heritage (DAWE 2020b, DAWE 2021d, DAWE 2021b). The remote-sensing approach developed by CSIRO aims to predict the quality of (mainly terrestrial) habitats in terms of the ‘capacity of a location to provide the structures and functions necessary for the persistence of all species naturally expected to occur there, as if it were in an intact reference state’. The purpose of HCAS is to distinguish natural variations in ecosystem responses to periodic disturbance from those attributed to land-use and management practices. Therefore, several years may be needed to confirm whether the trend after a disturbance is declining, steady or improving. The resulting HCAS dataset predicts site-level habitat condition for terrestrial biodiversity, with scores ranging from 0.0 (habitat completely removed) to 1.0 (habitat in reference condition). HCAS version 2.1 is a cumulative assessment of site-level habitat condition over 18 years to 2018, as depicted by the MODIS (Moderate Resolution Imaging Spectroradiometer) satellite’s optical sensor (Harwood et al. 2021b, Williams et al. 2021b) (Figure 9). HCAS on its own does not directly consider fragmentation (although such information can be derived from HCAS) and therefore potentially underestimates the loss of regional ecological integrity, especially in the intensive land-use zone. As a site-level estimate of condition, HCAS is intended as an input to other analyses, such as connectivity, to also account for the landscape consequences of fragmentation on ecosystem integrity. When these 2 dimensions of habitat condition are combined, they provide a means to consistently assess the quality of habitat, in terms of its capacity to retain biodiversity (Ferrier & Drielsma 2010). The integrated result can be used to support strategic prioritisation for natural resource management and, with repeated assessments over time, provide trends and trajectories of change. Comparisons with state agency mapping for Victoria (Newell et al. 2006, DSE 2007) and New South Wales (Love et al. 2020) indicate that, while trends are similar, HCAS version 2.1 presents a more optimistic view of habitat condition in the more intensively used regions. For example, the HCAS version 2.1 mean value for New South Wales is 0.63 (Williams et al. 2021b) compared with 0.44 estimated by Love et al. (2020), who used Landsat data and estimated the likely effects of land use on understorey and groundcover intactness. In part, this difference may relate to the limited ability of satellites to comprehensively observe the structure, function and compositional characteristics of Australia’s ecosystems, and especially of the understorey. However, satellite monitoring is expected to rapidly accelerate over the next few years with the introduction of new sensor systems, enabling more comprehensive assessment of changes in ecosystem condition (see case study: Digital Earth Australia: new technologies and partnerships to map Australia’s land). Figure 9 A national perspective on habitat condition for terrestrial biodiversity, showing the continuous site-level score in 5 classes that approximate the VAST narrative framework Expand View Figure 9 A national perspective on habitat condition for terrestrial biodiversity, showing the continuous site-level score in 5 classes that approximate the VAST narrative framework HCAS = Habitat Condition Assessment System; VAST = Vegetation Assets, States and Transitions Notes: HCAS estimates departure from reference (intact ecosystems) as depicted by the MODIS (Moderate Resolution Imaging Spectroradiometer) satellite remote sensing of vegetation cover for 250 × 250-metre pixels. HCAS scores less than 0.4 potentially represent places where some dominant structuring plant species indigenous to the locality may still be present but the land is largely under some form of cultivation. At lower scores (<0.2) the indigenous species have most likely been replaced by some form of intensive land use. Excluded: water bodies, salt lakes. Sources: Williams et al. (2021b), Harwood et al. (2021b); map projection: Australian Albers GDA94 (ICSM n.d.) For more information, go toNative vegetation Share on Twitter Share on Facebook Share on Linkedin Share this link
Expand View Figure 9 A national perspective on habitat condition for terrestrial biodiversity, showing the continuous site-level score in 5 classes that approximate the VAST narrative framework HCAS = Habitat Condition Assessment System; VAST = Vegetation Assets, States and Transitions Notes: HCAS estimates departure from reference (intact ecosystems) as depicted by the MODIS (Moderate Resolution Imaging Spectroradiometer) satellite remote sensing of vegetation cover for 250 × 250-metre pixels. HCAS scores less than 0.4 potentially represent places where some dominant structuring plant species indigenous to the locality may still be present but the land is largely under some form of cultivation. At lower scores (<0.2) the indigenous species have most likely been replaced by some form of intensive land use. Excluded: water bodies, salt lakes. Sources: Williams et al. (2021b), Harwood et al. (2021b); map projection: Australian Albers GDA94 (ICSM n.d.)
Expand View Figure 9 A national perspective on habitat condition for terrestrial biodiversity, showing the continuous site-level score in 5 classes that approximate the VAST narrative framework
Jane Stewart and Jasmine Howorth, Australian Bureau of Agricultural and Resource Economics and Sciences; Juan Guerschman and John Leys, CSIRO Nationally consistent and regularly updated vegetation cover information is a critical indicator for environmental targets related to soil erosion and land management in Australia. Vegetation cover reduces soil erosion, increases water infiltration, enables carbon sequestration, and contributes to agricultural production of food and fibre. Total vegetation cover, the sum of green and brown vegetation, is made available for Australia each month from satellite imagery. The 2017–19 drought in eastern Australia resulted in large areas having low total vegetation cover. The result was widespread dust storms through 2019–20 and water erosion in February 2020. These erosion events result in degradation of the soil. Across most of Australia (56%), the total vegetation cover was even lower in December 2019 than in December 2009 (the end of the millennium drought). The total vegetation cover anomaly maps show red for areas below the average, and blue for areas above the average for December (Figure 13). During December 2019, low cover is particularly noticeable in the Northern Territory, central New South Wales and southern Queensland. Low cover is shown across most of the Central West (New South Wales) and Border Rivers Maranoa–Balonne (Queensland) Natural Resource Management regions. Large areas within these regions are used for agriculture. The Australian Government Department of Agriculture, Water and the Environment aims to support sustainable, high-quality natural resources by ensuring that the quality of the resource base is maintained or improved. The indicator reported by the department is the area of agricultural land protected from soil erosion throughout the year (DAWE 2020d). Improving soil health is a key investment priority of the National Landcare Program’s Regional Land Partnerships (RLP) and Smart Farms programs, and aligns to the outcomes of the National Soil Strategy. The Smart Farms program funds soil extension officers located across the country, and will help farmers to access incentives for soil testing under the Pilot Soil Monitoring and Incentives Program. Extension officers will help farmers understand their soil test results and to make more informed management decisions. The RLP program is funding on-ground and sustainable agriculture projects from June 2018 to July 2023. The RLP program will monitor and report on groundcover as a key indicator for soil erosion regionally at the mid-point (2021) and the end of the program (2023). This RLP indicator measures the area of agricultural land protected from soil erosion above a threshold throughout the year. The annual target of 60% of Australian agricultural land protected from wind erosion was not met in 2019–20 (Figure 14). Wind erosion protection was lower in 2019–20 than in any year from 2001 to 2018. This target is set using the 10th percentile of total vegetation cover for Australia’s agricultural land from monthly MODIS (Moderate Resolution Imaging Spectroradiometer) satellite data (Leys et al. 2020). Results were affected by rainfall deficiencies (BOM 2020a). Large areas of Australia were also affected by fires (DAWE 2020d). Figure 13 Total vegetation cover anomaly for Australia in December 2009 and 2019 Expand View Figure 13 Total vegetation cover anomaly for Australia in December 2009 and 2019 Note: Total vegetation cover anomaly represents the difference between total vegetation cover (green plus brown components) in a given month and the mean total vegetation cover for that month in all available years, expressed in units of cover. Sources: An interactive version of this figure can be accessed via the GEOGLAM RAPP Map portal (CSIRO 2021c); map projection: Australian Albers GDA94 (ICSM n.d.) Figure 14 Agricultural land in Australia protected from wind erosion, 2009–10 and 2019–20 Expand View Figure 14 Agricultural land in Australia protected from wind erosion, 2009–10 and 2019–20 Note: The percentage of Australia’s agricultural land protected from wind erosion each month is shown for 2009–10 and 2019–20, compared with the range of monthly values between 2001 and 2018. Agricultural land is considered protected from wind erosion when each pixel has at least 50% total vegetation cover. Source: Howorth et al. (2020) Download Go to data.gov Note: This nationally agreed, reliable, cost-effective, validated method has been developed collaboratively. Funding was received through the National Landcare Program’s Regional Land Partnerships and previously Caring for our Country. Other major contributors include the New South Wales Government, CSIRO, Rangelands and Pasture Productivity map (GEOGLAM RAPP), Regional Agricultural Landcare Facilitators, and partners of the Australian Collaborative Land Use and Management Program. For further information, see ABARES (2020c). For more information, go toSoil Share on Twitter Share on Facebook Share on Linkedin Share this link
Expand View Figure 13 Total vegetation cover anomaly for Australia in December 2009 and 2019 Note: Total vegetation cover anomaly represents the difference between total vegetation cover (green plus brown components) in a given month and the mean total vegetation cover for that month in all available years, expressed in units of cover. Sources: An interactive version of this figure can be accessed via the GEOGLAM RAPP Map portal (CSIRO 2021c); map projection: Australian Albers GDA94 (ICSM n.d.)
Expand View Figure 14 Agricultural land in Australia protected from wind erosion, 2009–10 and 2019–20 Note: The percentage of Australia’s agricultural land protected from wind erosion each month is shown for 2009–10 and 2019–20, compared with the range of monthly values between 2001 and 2018. Agricultural land is considered protected from wind erosion when each pixel has at least 50% total vegetation cover. Source: Howorth et al. (2020) Download Go to data.gov
Expand View Figure 14 Agricultural land in Australia protected from wind erosion, 2009–10 and 2019–20
Jamie Cleverly, TERN, James Cook University; Lindsay B Hutley, TERN, Charles Darwin University; Beryl Morris, TERN, The University of Queensland; Graciela Metternicht, TERN, University of New South Wales; Matt Stenson, TERN, CSIRO; Mark Grant, TERN, The University of Queensland The Terrestrial Ecosystem Research Network (TERN) and its partner OzFlux provide research infrastructure and data that contribute to understanding how and why ecosystems change in Australia (Figure 23). Australian ecosystems are adapted to bushfires, aridity and wild weather, characterised by droughts, heatwaves, storms and flooding rains (Laurance et al. 2011, van Gorsel et al. 2016, Harris et al. 2018, Cleverly et al. 2019). These primary drivers of stress and change for Australia’s ecosystems have shaped them for millions of years, but over the past 3 decades, the frequency of events and ecosystems’ responses have changed in both marine and terrestrial environments. Significantly, these extremes of both wet and dry appear to be increasing in intensity (Cleverly et al. 2016a), giving us the opportunity to better understand the vulnerability or resilience of Australia’s ecosystems. In the midst of human and natural capital tragedies, from droughts and heatwaves in 2018 and 2019 to the 2019–20 bushfires, many Australian ecosystems have shown resilience to these extreme events. This does not mean that vegetation persisted in a business-as-usual mode during these times, but ecosystems have shown an enormous capacity to spring back by, for example, vegetation resprouting after bushfire and apparently recovering after the return of favourable conditions. TERN and OzFlux data directly quantify carbon and water fluxes from whole ecosystems, be they natural or agricultural. When combined with models and remote sensing, ecosystem responses to baseline or normal climate can be predicted. Novel satellite methods such as solar-induced fluorescence are being combined with these flux data to identify the timing and intensity of photosynthetic declines in response to the 2018–2019 drought and heatwave (Qiu et al. 2020), when temperature records were broken across northern-central Australia, and vegetation deteriorated or died across the region (Figure 24). In the tropical arid rangelands of central Australia, it is not unusual for the vegetation to remain more-or-less dormant during dry years, with no loss of photosynthetic productivity and associated carbon uptake upon a return to favourable conditions (Ma et al. 2013, Cleverly et al. 2016b, Ma et al. 2016, Tarin et al. 2020). Soil moisture can play an important role in sustaining resilience for Australian ecosystems. If soils are wet enough, as they were in Bago State Forest near Tumbarumba in New South Wales (Figure 25) during the ‘angry summer’ heatwave of 2012–13, the effects of drought on carbon and water fluxes can be ameliorated by evaporative cooling through transpiration from the leaves of trees (van Gorsel et al. 2016). Similarly, the drought of 2018–20 was preceded in 2017 by extraordinarily wet conditions in some parts of Australia, showing that alternation of droughts and heatwaves with flooding rains can recharge soil moisture levels and enhance photosynthetic productivity (Tarin et al. 2020). While TERN sites in the arid and semi-arid climates of Australia do not appear to be markedly vulnerable to water stress, vegetation in TERN’s wet rainforest and savanna sites express a riskier hydraulic behaviour that likely leaves them vulnerable to increasingly extreme climate (Laurance et al. 2011, Peters et al. 2021). In response to the extreme El Niño of 2015, which brought high temperatures, reduced rainfall and a rapid drop in sea levels, 7,400 hectares of mangroves died along the north Australian coast (Duke et al. 2017). Remote-sensing tools provided by TERN are essential to continue monitoring the extent of mangrove vulnerability in Australia’s coastal environments (TERN 2018, Lymburner et al. 2020) (see case study: A national mangrove monitoring system in support of sustainable management, in the Risks to mangroves section in the Coasts chapter). We have an urgent need to be able to predict or forecast ecosystem change in response to fluctuations in climate. TERN and the OzFlux research community are working towards the goal of predicting changes in phenology and carbon, energy and water fluxes across Australian agricultural and natural ecosystems. Attribution of specific climatic factors to effects on carbon and water fluxes requires a rigorous statistical framework, which was presented in an analysis of carbon, water and energy fluxes in agricultural landscapes across Australia (Cleverly et al. 2020). This work provided a key development towards predicting and forecasting carbon and water fluxes from knowledge of climate, along with our ability to identify where and when prediction is possible. By bringing a better understanding of ecosystem resilience and vulnerability to climate extremes, TERN can provide the agricultural sector with key factors to consider when improving resilience of crops. For example, Beringer et al. (2016) demonstrated that most Australian ecosystems and land converted to agricultural production expressed carbon and water fluxes that did not reflect the disturbance levels they are known to experience. These findings suggest that large fluctuations in carbon and water fluxes resulting from climate variability and extremes might provide some protection against land degradation, or at least allow for rebound of degraded land after the disturbance has concluded. Figure 23 TERN OzFlux ecosystem research network set up to provide Australian, New Zealand and global ecosystem modelling communities with consistent observations of energy, carbon and water exchange between the atmosphere and key Australian and New Zealand ecosystems Expand View Figure 23 TERN OzFlux ecosystem research network set up to provide Australian, New Zealand and global ecosystem modelling communities with consistent observations of energy, carbon and water exchange between the atmosphere and key Australian and New Zealand ecosystems TERN = Terrestrial Ecosystem Research Network Notes: Dark blue dots show the locations of TERN flux station towers across Australia and New Zealand, that form part of a global network. Small green dots show the locations of the TERN ecological surveillance plot network across Australia Orange squares show the locations of remote-sensing calibration-validation sites, including several that are co-located with flux towers across Australia. The images show examples of the varied activities and infrastructures managed by TERN across Australia. Source: Adapted from Cleverly et al. (2019) Figure 24 Timeseries showing mulga dynamics near Alice Springs. From top: March 2012 (wet period); June 2015 (dry period); July 2020 (following heatwaves – some mulga died and some recovered during the subsequent wet period) Expand View Figure 24 Timeseries showing mulga dynamics near Alice Springs. From top: March 2012 (wet period); June 2015 (dry period); July 2020 (following heatwaves – some mulga died and some recovered during the subsequent wet period) Photos: Emrys Leitch (TERN 2020) Figure 25 TERN OzFlux tower at Tumbarumba; this tower and ground equipment were impacted by the 2019–20 bushfires Expand View Figure 25 TERN OzFlux tower at Tumbarumba; this tower and ground equipment were impacted by the 2019–20 bushfires Note: For effects of the 2019–20 bushfires, see Local Biz to Web (2020) For more information, go toCarbon Share on Twitter Share on Facebook Share on Linkedin Share this link
Expand View Figure 23 TERN OzFlux ecosystem research network set up to provide Australian, New Zealand and global ecosystem modelling communities with consistent observations of energy, carbon and water exchange between the atmosphere and key Australian and New Zealand ecosystems TERN = Terrestrial Ecosystem Research Network Notes: Dark blue dots show the locations of TERN flux station towers across Australia and New Zealand, that form part of a global network. Small green dots show the locations of the TERN ecological surveillance plot network across Australia Orange squares show the locations of remote-sensing calibration-validation sites, including several that are co-located with flux towers across Australia. The images show examples of the varied activities and infrastructures managed by TERN across Australia. Source: Adapted from Cleverly et al. (2019)
Expand View Figure 23 TERN OzFlux ecosystem research network set up to provide Australian, New Zealand and global ecosystem modelling communities with consistent observations of energy, carbon and water exchange between the atmosphere and key Australian and New Zealand ecosystems
Expand View Figure 24 Timeseries showing mulga dynamics near Alice Springs. From top: March 2012 (wet period); June 2015 (dry period); July 2020 (following heatwaves – some mulga died and some recovered during the subsequent wet period) Photos: Emrys Leitch (TERN 2020)
Expand View Figure 24 Timeseries showing mulga dynamics near Alice Springs. From top: March 2012 (wet period); June 2015 (dry period); July 2020 (following heatwaves – some mulga died and some recovered during the subsequent wet period)
Expand View Figure 25 TERN OzFlux tower at Tumbarumba; this tower and ground equipment were impacted by the 2019–20 bushfires Note: For effects of the 2019–20 bushfires, see Local Biz to Web (2020)
Expand View Figure 25 TERN OzFlux tower at Tumbarumba; this tower and ground equipment were impacted by the 2019–20 bushfires
Between 2009 and 2014, 193,000 hectares (ha) of woody vegetation in New South Wales was cleared for the likely purposes of agriculture, forestry or infrastructure, an average of 32,167 hectares per year (Figure 37), leaving 61% of the state with structurally intact native vegetation cover as of 2014 (NSW EPA 2019). From 2015 to 2019, a further 271,900 ha of woody vegetation was cleared, averaging 54,380 hectares per year (Figure 38). The location of woody vegetation loss as a percentage of existing woody vegetation for 2019 is shown in Figure 39. The hotspots in central NSW are mainly associated with agricultural clearing, and those in the south and east are mainly forestry (DPIE 2021a). In 2019, 86% of clearing was for agriculture and forestry, and 14% for infrastructure (DPIE 2021a). Of the infrastructure clearing, 58% was associated with farm infrastructure (Figure 40). Clearing of woody vegetation for agriculture decreased by 20% in 2019 compared with 2018 (Figure 38). Forest re-establishment usually occurs in areas subjected to forest harvesting. New South Wales is developing methods for mapping regrowth, which will enable future reporting to also include vegetation gain. In recent years, several changes were made to New South Wales laws governing native vegetation management. The Native Vegetation Act 2003 was repealed on 25 August 2017, and clearing of native vegetation on rural land is now regulated through the Local Land Services Act 2013 and the Biodiversity Conservation Act 2016. Clearing of native vegetation in urban areas and land zoned for environmental protection is legislated by the New South Wales State Environmental Planning Policy (Vegetation in Non-Rural Areas) 2017 (Vegetation SEPP). Following introduction of the new laws, monitoring and reporting was extended to include nonwoody (grasses, small shrubs and groundcover) vegetation loss on rural regulated lands (DPIE 2020c). Nonwoody vegetation clearing on rural regulated lands over the 3 years of the new laws comprised 106,569 ha, bringing the total rural vegetation loss over that period to 186,795 ha. Of this total, 72% is yet to be associated with an authorisation (Figure 41), either because an approval was not required, or clearing was unlawful. Under amendments to the Local Land Services Act 2013, land clearing can occur in some areas under certain conditions – for example, provided equivalent areas are set aside from clearing. In 2019, 1,080 ha of vegetation was cleared for firefighting, accounting for 14% of vegetation loss in the infrastructure class (Figure 40). In 2020, the Bushfires Legislation Amendment Act 2020 amended the Rural Fires Act 1997 to allow rural landowners to clear up to 25 metres of vegetation for hazard reduction purposes without further approvals, from early 2021. Figure 38 Annual losses in woody vegetation in New South Wales, for agriculture, forestry and infrastructure land uses, 2009–19 Expand View Figure 38 Annual losses in woody vegetation in New South Wales, for agriculture, forestry and infrastructure land uses, 2009–19 Notes: Forestry clearing includes plantation as well as native forest harvest, and agricultural clearing may also include clearing of non-native woody weeds and replacement of woody horticulture. Forest re-establishment usually occurs in areas subjected to forest harvesting. Reduction in woody vegetation cover due to fire is usually temporary and therefore not included. See the results spreadsheet cited in DPIE (2021a) for notes on data. New South Wales reports annual loss of woody vegetation only; methods for mapping regrowing vegetation are under development. Source: Figure 6 in DPIE (2021a) Figure 39 Locations of woody vegetation loss in New South Wales as a percentage of existing woody vegetation, within 25 × 25-kilometre grid cells, 2019 Expand View Figure 39 Locations of woody vegetation loss in New South Wales as a percentage of existing woody vegetation, within 25 × 25-kilometre grid cells, 2019 Source: Figure 6 in DPIE (2021a) Figure 40 Proportion of vegetation loss for categories of infrastructure, 2019 Expand View Figure 40 Proportion of vegetation loss for categories of infrastructure, 2019 Source: Adapted from Figure 11 in DPIE (2021a) Figure 41 Extent of woody and nonwoody vegetation loss on rural regulated land by authorising Act, 2017–19 Expand View Figure 41 Extent of woody and nonwoody vegetation loss on rural regulated land by authorising Act, 2017–19 Note: Authorised clearing applies under the repealed Native Vegetation Act 2003 (NV Act), the Local Land Services Act 2013 (LLS Act) or other Acts (Plantation and Reafforestation Act 1999, Environmental Planning and Assessment Act 1979). Unexplained clearing refers to areas of vegetation loss on rural regulated land defined by the LLS Act for which the Department of Planning, Industry and Environment does not yet know the details. Source: Adapted from Figure 1 in DPIE (2021c) For more information, go toIndustry Share on Twitter Share on Facebook Share on Linkedin Share this link
Expand View Figure 38 Annual losses in woody vegetation in New South Wales, for agriculture, forestry and infrastructure land uses, 2009–19 Notes: Forestry clearing includes plantation as well as native forest harvest, and agricultural clearing may also include clearing of non-native woody weeds and replacement of woody horticulture. Forest re-establishment usually occurs in areas subjected to forest harvesting. Reduction in woody vegetation cover due to fire is usually temporary and therefore not included. See the results spreadsheet cited in DPIE (2021a) for notes on data. New South Wales reports annual loss of woody vegetation only; methods for mapping regrowing vegetation are under development. Source: Figure 6 in DPIE (2021a)
Expand View Figure 38 Annual losses in woody vegetation in New South Wales, for agriculture, forestry and infrastructure land uses, 2009–19
Expand View Figure 39 Locations of woody vegetation loss in New South Wales as a percentage of existing woody vegetation, within 25 × 25-kilometre grid cells, 2019 Source: Figure 6 in DPIE (2021a)
Expand View Figure 39 Locations of woody vegetation loss in New South Wales as a percentage of existing woody vegetation, within 25 × 25-kilometre grid cells, 2019
Expand View Figure 40 Proportion of vegetation loss for categories of infrastructure, 2019 Source: Adapted from Figure 11 in DPIE (2021a)
Expand View Figure 41 Extent of woody and nonwoody vegetation loss on rural regulated land by authorising Act, 2017–19 Note: Authorised clearing applies under the repealed Native Vegetation Act 2003 (NV Act), the Local Land Services Act 2013 (LLS Act) or other Acts (Plantation and Reafforestation Act 1999, Environmental Planning and Assessment Act 1979). Unexplained clearing refers to areas of vegetation loss on rural regulated land defined by the LLS Act for which the Department of Planning, Industry and Environment does not yet know the details. Source: Adapted from Figure 1 in DPIE (2021c)
Expand View Figure 41 Extent of woody and nonwoody vegetation loss on rural regulated land by authorising Act, 2017–19
Invasive insects are of particular concern because they can enter Australia through multiple pathways (Figure 50). Their association with a wide range of traded products and ability to endure adverse conditions during travel contribute to their invasiveness (McGeoch et al. 2020). Cut flower and foliage imports, along with plant nursery material and timber trade, are high-risk pathways for the introduction of invasive insects. Over the decade to 2017, for example, imports of cut flowers and foliage increased more than 3‑fold, and detections of live insects at the Australian border increased from 13% to 58% of consignments (McGeoch et al. 2020). Phytosanitary measures have since been introduced following risk assessments and industry consultation (DoA 2019b, DAWE 2021w). Of particular concern are hitchhiker or contaminating pests, the transportation of which is not linked to commodities or supply chains. Systems-based approaches are used to manage these pests, such as khapra beetle (Trogoderma granarium), brown marmorated stink bug (Halyomorpha halys) and Asian gypsy moth (Lymantria dispar asiatica). Others such as fall armyworm (Spodoptera frugiperda) arrived naturally on air currents. Invasive insects negatively impact native species primarily though competition, predation and herbivory, often concurrently, exacerbating the impact (McGeoch et al. 2020). Table 1 in McGeoch et al. (2020) lists 17 invasive insect species for which there is evidence of environmental harm in Australia. These comprise 16 species from order Hymenoptera (9 ant species, and 7 bee or wasp species) and 1 beetle from order Coleoptera. While ants, bees and wasps dominate the environmental invaders, beetles, bugs, moths and flies are the common agricultural invaders (McGeoch et al. 2020). Eradication programs are underway in several states and territories to address incursions by 5 of the more serious invasive ant species, including red imported fire ant and yellow crazy ant (Environment and Invasives Committee 2019). Australia has the highest success rate globally in invasive ant eradications. For example, 5 out of 6 tropical fire ant infestations have been eradicated from Indigenous land in northern Australia, with the last likely to succeed in the next 12 months. Yellow crazy ants affecting remote Northern Territory communities have been removed from more than 1,000 hectares, with the risk for further spread eliminated (Hoffmann 2019). Some incursions, such as the red imported fire ant, pose such a high risk to people, industry and the environment that costly eradication measures are justified (Jansse 2017). Figure 50 Most prevalent introduction pathways used by invasive insects Expand View Figure 50 Most prevalent introduction pathways used by invasive insects Note: Circles and their sizes represent the relative contribution (%) of each insect order to the number of species using a particular pathway (in 10% increments up to 60%). Source: McGeoch et al. (2020) For more information, go toIntroduced and invasive species Share on Twitter Share on Facebook Share on Linkedin Share this link
Expand View Figure 50 Most prevalent introduction pathways used by invasive insects Note: Circles and their sizes represent the relative contribution (%) of each insect order to the number of species using a particular pathway (in 10% increments up to 60%). Source: McGeoch et al. (2020)
Wunambal Gaambera Aboriginal Corporation On the far north-western coast of the Kimberley region in Western Australia are the lands and waters of the Wunambal Gaambera people. This remote biodiversity hotspot, characterised by sandy coastline, escarpment plateau, rocky gullies and pockets of tropical rainforest covers an extensive 2.5 million hectares (BHA 2021b). Following native title determinations in 2011 and 2012, the Wunambal Gaambera people (WGAC 2020) dedicated areas of their land to form the Uunguu Indigenous Protected Area (IPA), which extends across 759,806 hectares (NIAA 2021b). Management of Wunambal Gaambera Country is guided by the Wunambal Gaambera Healthy Country Plan (WGAC 2010), which delivers the vision for management of the extensive region, embedded in cultural governance underpinned by traditional Wanjina and Wunggurr Law. The plan articulates 10 critical areas of management foci for looking after Uunguu: Wanjina Wunggurr Law; right way fire; aamba (kangaroos and wallabies) and other meat foods; wulo (rainforest); yawal (waterholes); bush plants; rock art; cultural places on islands; fish and other seafoods; and mangguru (marine turtles) and balguja (dugong) (WGAC 2010). Key aspects of the Healthy Country Plan are fire management, weed and feral animal control, visitor management through the Uunguu Visitor Pass, conservation of cultural heritage, and monitoring plant and animal health. The Wunambal Gaambera Aboriginal Corporation (WGAC) is responsible for implementing the Healthy Country Plan (WGAC 2010). WGAC’s Healthy Country Team is headed by a Healthy Country Manager, and the Uunguu rangers lead the work. Further, in a concerted effort to foster collaborative governance and management arrangements, Wunambal Gaambera has dedicated the Uunguu Wundaagu (Saltwater) IPA through voluntary processes (WGAC 2017). This area of saltwater Country co-exists with statutory marine parks and reserves: the North Kimberley Marine Park and the Kimberley Commonwealth Marine Reserve. Wunambal Gaambera involvement enables customary management of their Country through their traditional knowledge, management of cultural places and customary use of resources (WGAC 2017) in a partnership approach with the Western Australia and Australian governments. The current Heathy Country Plan is being revised in 2021−22. WGAC’s vision for the next 10 years is for their people to secure sustainable livelihoods on and from their Country (WGAC 2021). Figure 60 Uunguu Ranger Jeremy Kowan on the culture walk along the King Edward River (left); Wunambal Gaambera Country (right) Expand View Figure 60 Uunguu Ranger Jeremy Kowan on the culture walk along the King Edward River (left); Wunambal Gaambera Country (right) Photos: Wunambal Gaambera Aboriginal Corporation For more information, go toManagement approaches Share on Twitter Share on Facebook Share on Linkedin Share this link
Expand View Figure 60 Uunguu Ranger Jeremy Kowan on the culture walk along the King Edward River (left); Wunambal Gaambera Country (right) Photos: Wunambal Gaambera Aboriginal Corporation
Expand View Figure 60 Uunguu Ranger Jeremy Kowan on the culture walk along the King Edward River (left); Wunambal Gaambera Country (right)
The Indigenous Land and Sea Corporation (ILSC) is an independent statutory authority of the Australian Government. The ILSC has 2 purposes, as set out in the Aboriginal and Torres Strait Islander Act 2005: to assist Indigenous Australians to acquire land and water-related rights; and to assist in the management of Indigenous-held land and waters, however they were acquired (ILSC 2019b). The National Indigenous Land and Sea Strategy (NILSS; ILSC 2019b) is the ILSC’s key policy document, with implementation guided by Regional Indigenous Land and Sea Strategies. The 4 regional strategies – for northern (ILSC 2020c), desert (ILSC 2020d), south-western (ILSC 2020e) and south-eastern Australia (ILSC 2020a) – highlight regional opportunities aligned with the 5 focus areas identified in the NILSS: conservation and healthy Country, urban investment, agribusiness, tourism, and niche Indigenous products (ILSC 2020b). The operations of the ILSC directly align with the government priority of economic development on Indigenous-held land and waters, within a framing of ‘unlocking the Indigenous estate’. Since 1995, the ILSC has purchased 274 land and water interests covering 6.3 million hectares (ILSC 2021). As well as acquiring land, and directing and supporting Indigenous enterprise development, the ILSC plays a role in building the capacity and capability of Indigenous people to sustainably manage and protect Country, including preserving and protecting cultural and environmental sites and traditional knowledge through reconnection with Country (e.g. Figure 62). According to ILSC annual reporting over the past 5 years (2016–17 to 2020–21), the key performance indicator (KPI 4) that reflects the ILSC group’s contribution towards its core purpose of maintaining, protecting and enhancing cultural and environmental values of Indigenous-held land has ranged between 28% (2019–20; as a proportion of all active projects) and 58.6% (2020–21; as a proportion of new projects commenced in that reporting period), against the target of 50% (ILC 2017, ILSC 2020b). The ILSC acknowledges that while they continue to prioritise balancing investment to explicitly encompass social, cultural and environmental values (as well as economic), the scope and focus of projects remain responsive to the aspirations of the Indigenous proponents, who have delivered more commercial and economically focused project proposals in recent years (ILSC 2020b). Figure 62 Indigenous trainees on Roebuck Plains station, Yawuru country, Western Australia (left); Tourists and visitors at the Talaroo Hot Springs on Ewamian Country, Queensland (right) Expand View Figure 62 Indigenous trainees on Roebuck Plains station, Yawuru country, Western Australia (left); Tourists and visitors at the Talaroo Hot Springs on Ewamian Country, Queensland (right) Photos: Indigenous Land and Sea Corporation For more information, go toManagement approaches Share on Twitter Share on Facebook Share on Linkedin Share this link
Expand View Figure 62 Indigenous trainees on Roebuck Plains station, Yawuru country, Western Australia (left); Tourists and visitors at the Talaroo Hot Springs on Ewamian Country, Queensland (right) Photos: Indigenous Land and Sea Corporation
Expand View Figure 62 Indigenous trainees on Roebuck Plains station, Yawuru country, Western Australia (left); Tourists and visitors at the Talaroo Hot Springs on Ewamian Country, Queensland (right)
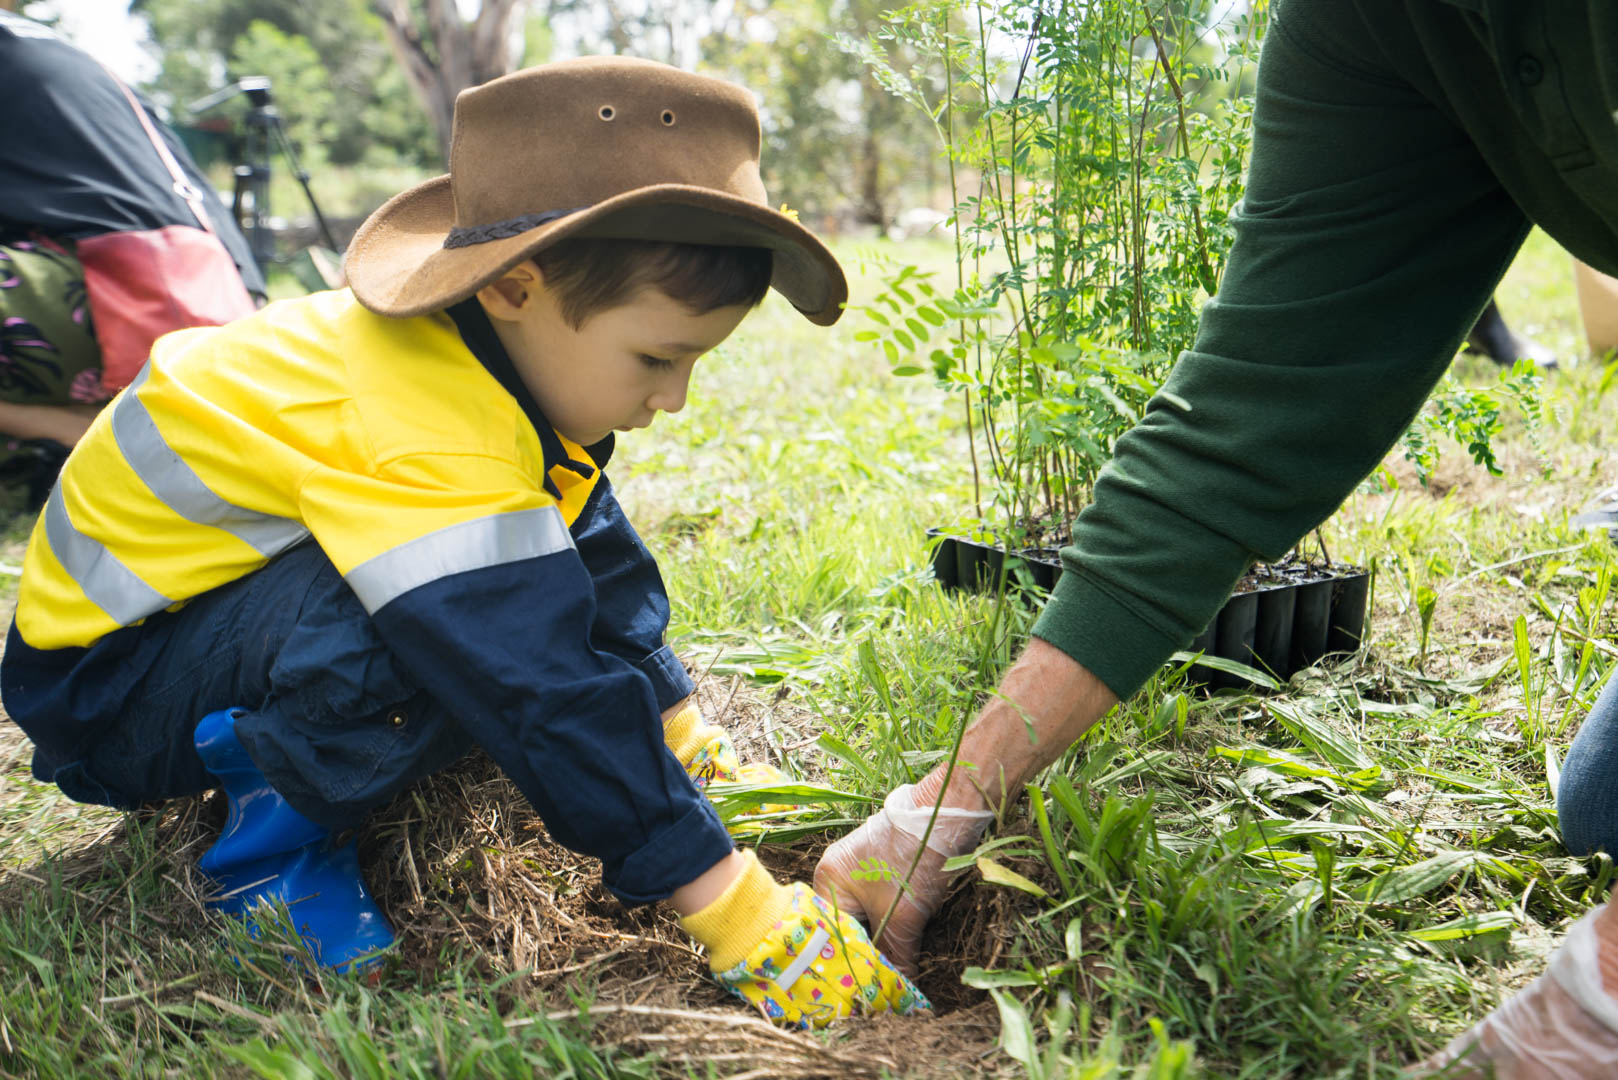
Renee Young, Western Australian Biodiversity Science Institute The restoration economy is defined as the market consisting of a network of businesses, investors and consumers engaging in economic activity related to ecological restoration (BenDor et al. 2015). Australia, as a large, sparsely populated, politically stable country, is well placed to take advantage of major national and international investment opportunities through the restoration economy (Young et al. in press). Internationally and across Australia, major private, philanthropic and government investments are driving large-scale restoration efforts by obtaining carbon credits through biodiverse plantings. Carbon credits issued by the Clean Energy Regulator increased from 100,000 tonnes per month in 2018 to 350,000–400,000 tonnes per month in 2020 (pre-COVID-19) (Foley 2021). The international market price for carbon is projected to double in the next 15 years (Piris-Cabezas et al. 2018), and carbon projects that deliver co-benefits will return a premium price. Further, it is likely that industry will soon need to report on nature-related risks to support a shift in global financial flows towards nature-positive outcomes (TNFD 2021b, TNFD 2021a), giving additional value and security to the market. Australian philanthropists are pledging tens of millions of dollars to address climate change, with Norman Pater and Gita Sonnenberg aiming to restore 1 million hectares and test carbon-farming models at scale. Queenslanders Julie and Jeff Wicks set up the ACME Foundation, which directs funding to 25–30 organisations, including Beyond Zero Emissions (Sommer 2020). Investment in the restoration economy translates to jobs, predominantly in our regional communities. Government economic stimulus as a result of the COVID-19 pandemic has seen a boost in ‘green jobs’, with direct funding going towards environmental projects such as Western Australia’s $15 million Native Vegetation Rehabilitation Scheme, creating more than 1,000 jobs (DPCD 2020, WA Government 2020). Coupled with these economic activities is the realisation that well-designed, biodiverse and knowledge-rich restoration has the capacity to deliver environmental, social, economic and cultural co-benefits that: support environmental assets such as improved biodiversity and habitat for threatened species, as well as healthier soils, wetlands and water systems improve the resilience and strength of regional communities by supporting direct and indirect jobs and increasing economic opportunities provide on-Country Indigenous business opportunities and new service delivery businesses, as well as supporting cultural and customary connections (Land Restoration Fund 2020, Queensland Government 2021a). Figure 63 Planting native vegetation to restore both the environment and economy Expand View Figure 63 Planting native vegetation to restore both the environment and economy Note: Staff from online furniture business Koala at a tree planting event at Cook Park in Ruse. The event included a live cross on the Today show to promote Koala’s support of WWF-Australia’s Towards Two Billion Trees campaign. Photo: © WWF-Australia / Paul Fahy For more information, go toManagement approaches Share on Twitter Share on Facebook Share on Linkedin Share this link
Expand View Figure 63 Planting native vegetation to restore both the environment and economy Note: Staff from online furniture business Koala at a tree planting event at Cook Park in Ruse. The event included a live cross on the Today show to promote Koala’s support of WWF-Australia’s Towards Two Billion Trees campaign. Photo: © WWF-Australia / Paul Fahy
Elise Raulings, Greening Australia; Christopher Ewing, WWF-Australia; Suzanne Prober, CSIRO Following the devastating Black Summer bushfires of 2019–20, Greening Australia and WWF-Australia formed a strategic partnership to innovate, accelerate and amplify practical, climate-adapted ‘renovation’ approaches to landscape management and restoration (Greening Australia 2021b, WWF-Australia 2021). Over the next 4 years, the initial focus will be on identifying, experimentally testing and prototyping solutions that have the potential for the greatest long-term benefits for nature and people, so that by 2025 these solutions can become mainstream practices that can be applied on a large scale (WWF-Australia & Greening Australia 2021). The 2 organisations have committed $20 million in initial climate-ready restoration projects, with additional support from public and private sectors to deliver the program of work. Genetic approaches that include targeting climate- and trait-adjusted seed-sourcing show great promise as a nature-based ‘renovation’ solution (Prober et al. 2019a). These approaches involve using seeds from places that match future climate conditions of the restored landscape, and/or choosing seeds that have characteristics suited to future environments. Many scientists have recommended the use of climate- and trait-adjusted seed (e.g. Prober et al. 2015, Harrison et al. 2017, Breed et al. 2018), but despite the development of multiple guidelines (e.g. Hancock et al. 2018, Standards Reference Group SERA 2018, Jellinek & Bailey 2020), decision support tools (e.g. Restore and Renew; Rossetto et al. 2019, RBGS 2021) and practical examples (Jordan & Hoffmann 2017, Greening Australia 2021a), this solution has not been widely tested or adopted. Barriers to uptake of climate-adjusted seed-sourcing include time constraints associated with funding cycles, lack of ‘know-how’, social concern about ‘playing god’ and/or creating unintended consequences, inability to collect or access suitable seed, and a lack of scale in the delivery of climate-targeted seed. The Greening Australia / WWF-Australia partnership aims to overcome these barriers to enable climate-adjusted seed approaches to be delivered at scale, and further the case for ecosystem renovation by: broadening the knowledge base and engaging a community of practice through a Climate-ready Restoration Knowledge Hub (participants range from volunteers to government agencies and large corporations) showcasing on-ground measures at demonstration sites, that also serve to experimentally test and inform further lessons to be shared through the knowledge hub (Figure 64) refining ecosystem renovation approaches to share methods for practical application identifying barriers to scaling up nature-based solutions that can measurably improve resilience and reduce risk in a changing climate. Figure 64 WWF-Australia’s 2018 community tree planting event at Oxley Park, Sydney, with Greening Australia Expand View Figure 64 WWF-Australia’s 2018 community tree planting event at Oxley Park, Sydney, with Greening Australia Note: The partnership will explore the potential for careful revegetation informed by fire ecology to create ‘green firebreaks’ that measurably reduce bushfire risk and improve resilience. Photo: © WWF-Australia / Leonie Sii For more information, go toManagement approaches Share on Twitter Share on Facebook Share on Linkedin Share this link
Expand View Figure 64 WWF-Australia’s 2018 community tree planting event at Oxley Park, Sydney, with Greening Australia Note: The partnership will explore the potential for careful revegetation informed by fire ecology to create ‘green firebreaks’ that measurably reduce bushfire risk and improve resilience. Photo: © WWF-Australia / Leonie Sii
Expand View Figure 64 WWF-Australia’s 2018 community tree planting event at Oxley Park, Sydney, with Greening Australia
Sue Bestow, Australian Government Department of the Prime Minister and Cabinet The position of National Soils Advocate was established to raise awareness of the vital role soils play in human wellbeing and the health of the environment. This position provides leadership and advocacy on the importance of conserving and improving the health of Australia’s soils, and is a world first in terms of elevating soil health and its functions to a level of national significance. The role contributes to the national objective of protecting, restoring and maintaining the health of the Australian agricultural landscape, to enhance productivity, assure a food-secure nation and support sustainable farming communities. The National Soils Advocate is an independent voice for soil health, supporting collaboration across a range of networks, organisations and land managers at local, regional, national and global levels. The National Soils Advocate is working to: elevate the importance of, and gain support for, improving soil health across sectors raise stakeholder awareness about the importance of maintaining and building soil health, and increasing skills and capacity to improve soil health, agricultural soil and landscape conditions, by increasing understanding of −the critical role soil health plays in sustainable agricultural production and the follow‑on economic benefits that can result −how improved soil health will benefit the environment and help to meet global challenges, most notably food security and climate change provide leadership and gain the support of industry, governments and researchers to change practices to improve soil health engage with current and emerging soils research support productive networks to share knowledge and resources provide input and ongoing support for the National Soil Strategy (DAWE 2021t). Australia is not alone in facing soil sustainability concerns; many areas of the world are facing substantial soil, water, food and nutrition issues. The growing global population is increasing the demand for food and fibre, placing ever more pressure on the environment. This emphasises the need for managing natural resources, including soils, more sustainably. Soils have a critical, and too often undervalued, role in addressing global challenges, including food security and adapting to a changing climate. Australia’s considerable experience and skills in land and water management, and the effort it is committing to soils, is of considerable interest to other countries and the National Soils Advocate will help to share this expertise. The Honourable Penelope Wensley AC (Figure 65) was appointed as Australia’s second National Soils Advocate on 28 August 2020, succeeding the late Major General the Honourable Michael Jeffery, AC, AO (Mil), CVO, MC (Retd). A former Governor of Queensland and distinguished Australian diplomat, Ms Wensley has a long-held interest and substantial experience in natural resource management, environmental and sustainable development matters, and in Australia’s response to national and global challenges in these areas. Secretariat and policy support are provided by the Office of the National Soils Advocate, in the Department of the Prime Minister and Cabinet. Figure 65 National Soils Advocate, the Honourable Penelope Wensley AC, inspecting a field of mixed pasture that is providing a good level of groundcover for healthy soils Expand View Figure 65 National Soils Advocate, the Honourable Penelope Wensley AC, inspecting a field of mixed pasture that is providing a good level of groundcover for healthy soils Photo: James Walsh, ACIAR For more information, go toManagement approaches Share on Twitter Share on Facebook Share on Linkedin Share this link
Expand View Figure 65 National Soils Advocate, the Honourable Penelope Wensley AC, inspecting a field of mixed pasture that is providing a good level of groundcover for healthy soils Photo: James Walsh, ACIAR
Expand View Figure 65 National Soils Advocate, the Honourable Penelope Wensley AC, inspecting a field of mixed pasture that is providing a good level of groundcover for healthy soils