Photos: Robyn Schofield and Alan Griffiths

We recognise Aboriginal and Torres Strait Islanders as the sovereign Traditional Owners of Australia and thank them for their stewardship of this Country, its lands, waters and skies. We respectfully acknowledge their culture and customary practices, and pay respect to their Ancestors, Elders and future leaders.
For the first time, the State of the Environment report includes a strong Indigenous narrative across all 12 thematic chapters, a narrative crafted through recognising the leadership, collaboration and authorship of Indigenous Australians who continue their connection as Traditional Owners to their lands, waters and skies.
Click to view the State of the Environment report
On 28 March 2025 the government assumed a Caretaker role. Information on websites maintained by the Department of Climate Change, Energy, the Environment and Water will be published in accordance with the Guidance on Caretaker Conventions until after the conclusion of the caretaker period.
Due to technical issues, graphs, maps and tables are currently not displaying within the main content, however, are available via the chapter resources navigation bar. We are working on a solution to resolve the issue.
Photos: Robyn Schofield and Alan Griffiths

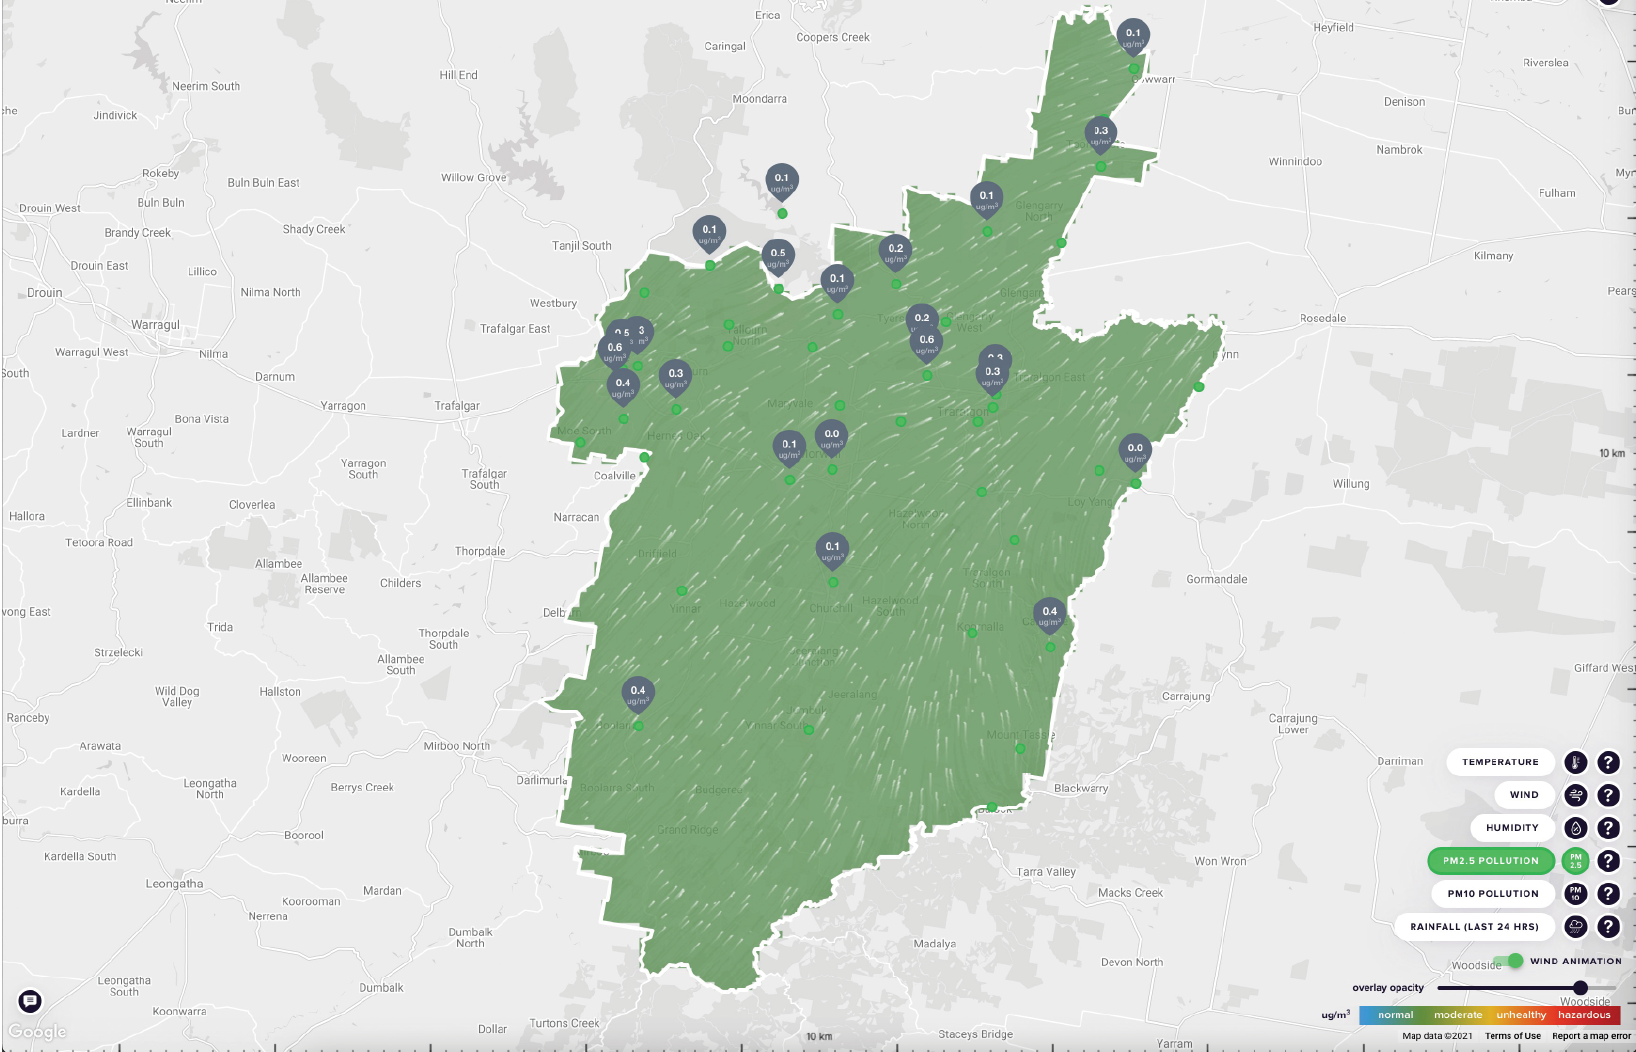
hrs = hours; µg/m3 = microgram per cubic metre; PM2.5 = fine particulate matter; PM10 = coarse particulate matter

Photo: Jacinta Cooper
|
Year |
Month |
Jurisdiction |
Air quality event |
Pollutant involved |
|---|---|---|---|---|
|
2016 |
January |
Tas |
Bushfires in north-west Tasmania burn 91,983 haa,b |
Smoke |
|
2016 |
January |
WA |
Bushfire at Yarloop burns 67,871 haa,b |
Smoke |
|
2016 |
November |
Vic |
Thunderstorm asthma kills 10 peoplec |
Pollen |
|
2018 |
August |
Vic |
20,000 m2 factory fire occurs on site storing waste at West Footscrayd |
Smoke |
|
2019 |
Summer |
Tas |
Bushfires west of Huon Valley burn 170,988 haa,b |
Smoke |
|
2019 |
April |
Vic |
Large factory fire occurs on site storing waste at Campbellfielde |
Smoke |
|
2019 |
November |
NSW |
Dustiest month since records began in 2005f |
Dust |
|
2019–20 |
Summer |
South-east Australia |
Bushfires burn 5,567,402 haa,b, contributing to 417 excess deathsg |
Smoke, accompanied by smog |
|
2020 |
March–April |
Australia |
COVID-19 pandemic |
Varies by jurisdiction |
|
2020 |
May |
WA |
Cyclone Mangga produces 100 km/h winds and very high levels of PM10 in Geraldton |
Dust |
ha = hectare; km/h = kilometre per hour; m2 = square metre; NSW = New South Wales; PM10 = coarse particulate matter; Tas = Tasmania; Vic = Victoria; WA = Western Australia
Sources: a MODIS MCD64A1 Collection 6 Burned Area product; b Giglio et al. (2018); c DHHS (2017); d IGEM (2020); e Personal communication, EPA Victoria; f Community DustWatch (2019); g Borchers Arriagada et al. (2020)
|
Type of pollutant |
Pollutant |
Major sources |
|---|---|---|
|
Primary pollutants |
Carbon monoxide |
|
|
Nitrogen dioxide (NO2) and nitric oxide (NO), together termed NOx |
|
|
|
Sulfur dioxide |
|
|
|
Coarse particulate matter (PM10) |
|
|
|
Fine particulate matter (PM2.5) |
|
|
|
Volatile organic compounds (VOCs) |
|
|
|
Secondary pollutants |
Ozone |
|
|
Hazardous substances |
Lead |
|
|
Mercury |
|
|
|
Persistent organic pollutants (POPs) and polycyclic aromatic hydrocarbons (PAHs) |
|
|
|
Allergens |
Pollen, fungal spores |
|
|
Pollutant |
Averaging period |
Maximum concentration (NEPM variationa) |
Maximum allowable exceedances (goal) |
|---|---|---|---|
|
Carbon monoxide |
8 hours |
9.0 ppm |
1 day per year |
|
Lead |
1 year |
0.50 μg/m3 |
None |
|
Nitrogen dioxide |
1 hour 1 year |
0.12 ppm (0.09 ppma) 0.03 ppm (0.019 ppma) |
1 day per year None |
|
PM10 |
1 day 1 year |
50 μg/m3 25 μg/m3 |
Noneb |
|
PM2.5 |
1 day 1 year |
25 μg/m3 8 μg/m3 |
Noneb (2025: 20 μg/m3) (7 μg/m3 2025 goal) |
|
Ozone |
1 hour 4 hours 8 hoursa |
0.10 ppm 0.08 ppm (0.065 ppma) |
1 day per year 1 day per year (Nonea) |
|
Sulfur dioxide |
1 hour 1 day 1 year |
0.20 ppm (0.10 ppma) 0.08 ppm (0.02 ppma) 0.02 ppm |
1 day per year (2025: 0.075 ppma) 1 day per year None |
μg/m3 = microgram per cubic metre; NEPM = National Environment Protection Measure; PM2.5 = fine particulate matter; PM10 = coarse particulate matter; ppm = parts per million
|
Pollutant |
Measurement technique |
|---|---|
|
Carbon monoxide |
Infrared spectrometry |
|
Ozone |
Ultraviolet spectroscopy |
|
Nitrogen dioxide |
Chemiluminescence |
|
Fine particulate matter (PM2.5) |
Beta attenuation monitor |
|
Coarse particulate matter (PM10) |
Tapered element oscillating microbalance |
|
Sulfur dioxide |
Pulsed fluorescent spectrophotometry |
|
Priority areas |
Actions |
Status |
|---|---|---|
|
Standards |
|
Complete |
|
Complete |
|
|
Complete |
|
|
Ongoing |
|
|
Emissions reduction measures |
|
Complete |
|
Ongoing |
|
|
Ongoing |
|
|
Partnerships and cooperation |
|
Ongoing |
|
Complete |
|
|
Better knowledge, education and awareness |
|
Complete |
|
Ongoing |
|
|
Priority setting |
|
Complete |
NEPM = National Environment Protection Measure; RIS = regulation impact statement
|
Priority areas |
Actions |
|---|---|
|
Standards |
|
|
Emissions reduction measures |
|
|
Partnerships and cooperation |
|
|
Better knowledge, education and awareness |
|
NEPM = National Environment Protection Measure; PM10 = coarse particulate matter; RIS = regulation impact statement