Courtesy Gunditj Mirring Traditional Owners Aboriginal Corporation. Photo: Ian McNiven, republished from The Conservation.

We recognise Aboriginal and Torres Strait Islanders as the sovereign Traditional Owners of Australia and thank them for their stewardship of this Country, its lands, waters and skies. We respectfully acknowledge their culture and customary practices, and pay respect to their Ancestors, Elders and future leaders.
For the first time, the State of the Environment report includes a strong Indigenous narrative across all 12 thematic chapters, a narrative crafted through recognising the leadership, collaboration and authorship of Indigenous Australians who continue their connection as Traditional Owners to their lands, waters and skies.
Click to view the State of the Environment report
On 28 March 2025 the government assumed a Caretaker role. Information on websites maintained by the Department of Climate Change, Energy, the Environment and Water will be published in accordance with the Guidance on Caretaker Conventions until after the conclusion of the caretaker period.
Due to technical issues, graphs, maps and tables are currently not displaying within the main content, however, are available via the chapter resources navigation bar. We are working on a solution to resolve the issue.
Courtesy Gunditj Mirring Traditional Owners Aboriginal Corporation. Photo: Ian McNiven, republished from The Conservation.

Source: Australian Government Department of Industry, Science, Energy and Resources

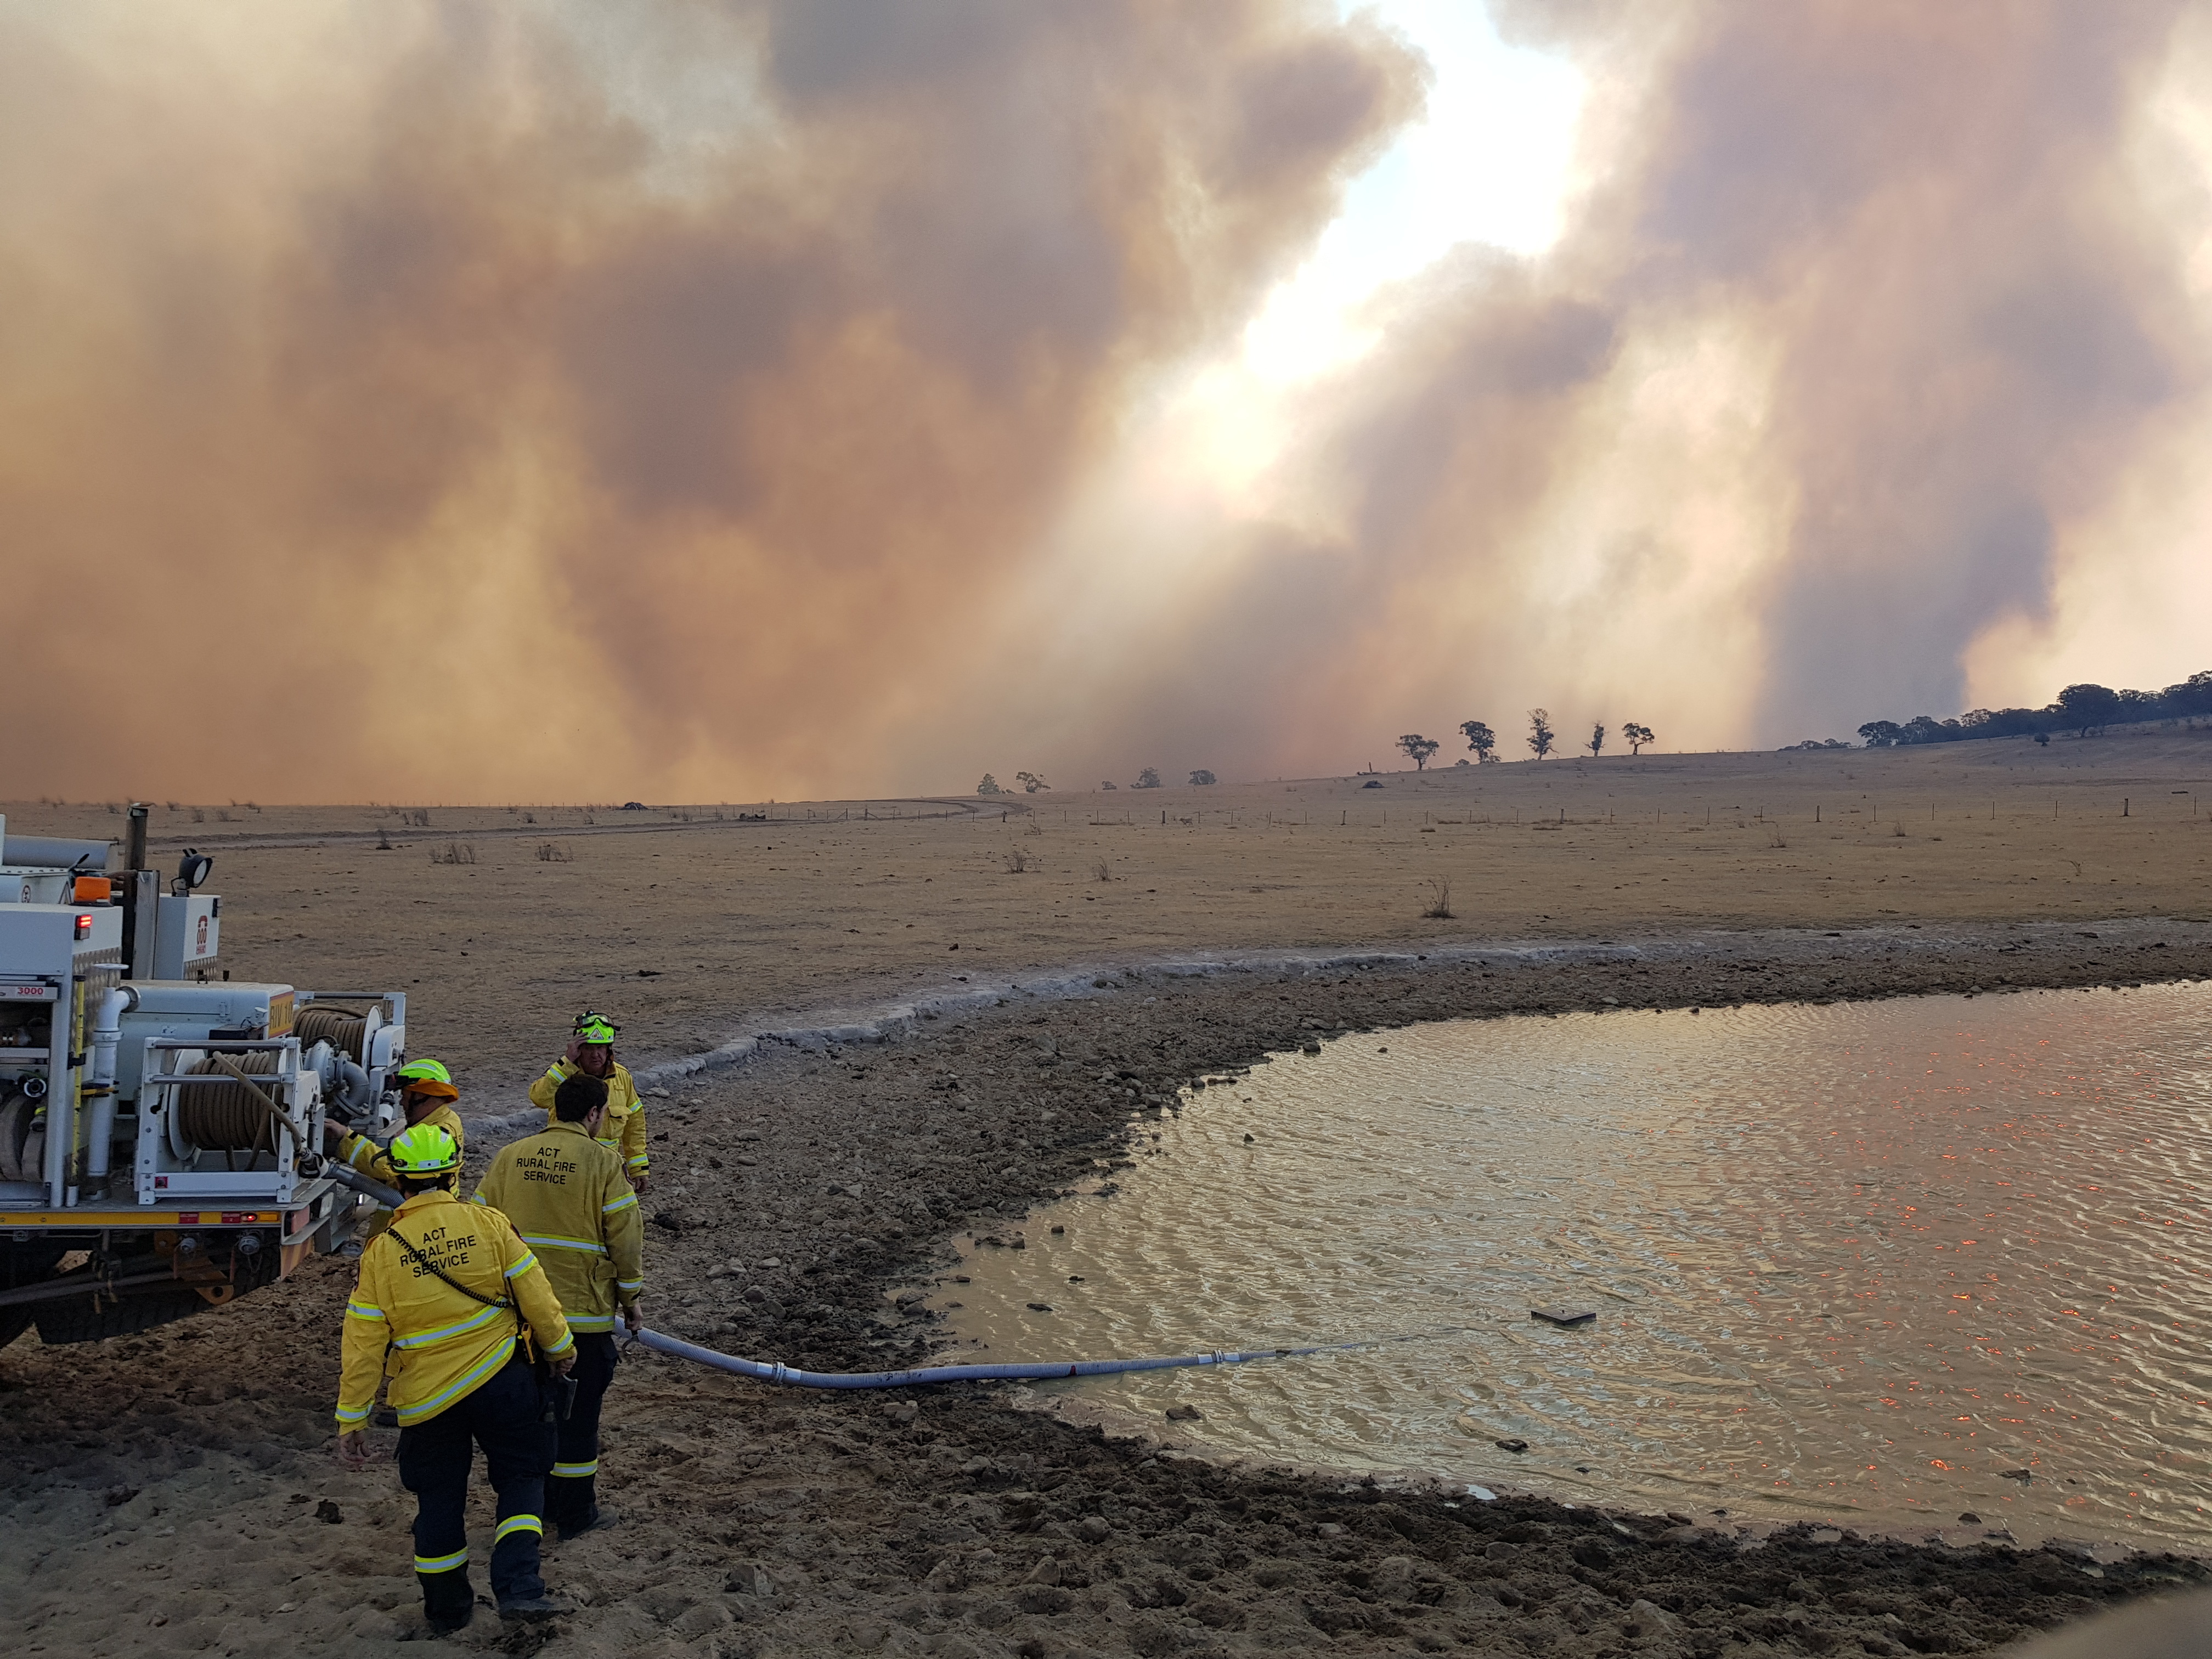
Photo: Philippe Frost

Note: Compliant loss occurs with a referral under the Environment Protection and Biodiversity Conservation Act 1999. Noncompliant loss occurs without a referral. Three panels highlight the southern Western Australia coast (left), Tasmania (middle) and northern Queensland coast (right).
Source: Ward et al. (2019)

PJ = petajoule
Source: Australian Government Department of Industry, Science, Energy and Resources

CO2 = carbon dioxide; Mt = megatonne
Source: DISER (2021b)

Source: Based on data aggregated by the Atlas of Living Australia from multiple sources, including Terrestrial Ecosystem Research Network survey and monitoring data, as of September 2021 (EcoAssets 2021)