Fixed air quality monitoring stations have scientific instruments that are calibrated to recognise national standards; they are continuously maintained, and the data quality is checked. This requires a high level of effort and financial resourcing, which means that numbers of fixed monitoring stations are limited. They are located to be representative of the air quality experienced by a whole community, but sometimes high levels of pollution may be limited to a very localised areas, or a regional town where there is no fixed monitoring site.
There are many low-cost sensors on the market that purport to measure pollutant concentrations. However, sensors are not research-grade scientific instruments, and their factory calibrations can quickly drift once in use. Their performance can also be affected by ambient temperature and relative humidity. But sensors can indicate trends in air quality, and because of their low cost can be used to develop high-density measurement networks.
Importantly, low-cost sensors can be used by the public to monitor their personal exposure to air pollution. Known as ‘citizen science’, the ability to make air quality measurements empowers affected communities and can provide additional information to the air quality monitoring stations operated by states and territories.
Researchers at Queensland’s University of Technology (QUT) evaluated the performance of low-cost sensors for a range of purposes. The research found that these sensors were unsuitable for measuring low particle concentrations in clean conditions, and poor when there is a lot of moisture in the air (high relative humidity) (Jayaratne et al. 2018). One of QUT’s recommendations was that individual sensors are calibrated according to the intended source category of particles to measured, because differences were found in the performance of the sensor when exposed to concrete dust or combustion-derived particles in the laboratory (Jayaratne et al. 2020).
Examples of applications of low-cost sensor networks are provided below.
Investigating nuisance and improving understanding
Wynnum (Queensland) is located close to the Brisbane port, where coal is transported by train from mines in southern Queensland and loaded onto ships for export. Residents were concerned about large volumes of black dust in the air, which deposited around their homes.
For 1 year commencing in December 2018, Queensland’s Department of Science and the Environment helped residents to determine whether the coal trains were the cause of the dust at Wynnum (Queensland Department of Environment and Science 2020). Residents used particulate matter (PM) sensors and collected dust for analysis by wiping down surfaces. Residents were also encouraged to keep a record of other activities, such as lawnmowing, and evidence of smoke that could affect their measurements.
PM levels were measured to be well below the National Environment Protection Measures standards across the year, although did increase with prescribed burns and bushfire smoke. The composition of dust collected from the surface wipes showed high concentrations of soil or rock particles (52%) and rubber (20%), both as a result of vehicles resuspending road dust, and tyre and brake dust. Microscopic analysis for coal particles determined that less than 1% of dust collected at Wynnum homes was from coal. Residents found learning about the relationships between wind speed and direction and fluctuations in their sensor readings very interesting, as they could relate the peaks to specific sources.
Increasing spatial coverage
During the 2018 Commonwealth Games on the Gold Coast, Queensland, Knowing our Ambient Local Air (KOALA) sensors built by QUT provided real-time evidence of the very clean conditions at 10 locations where athletes were competing. KOALAs were also deployed in the Blue Mountains and Lithgow, New South Wales, in May 2019 to capture the current air quality and study how it might be improved in future (NSW EPA 2020).
The University of Wollongong built and deployed a network of 20 sensors around the city of Liverpool, New South Wales, to determine spatial gradients in air quality (Forehead et al. 2020). The study showed elevated PM concentrations at busy roadsides, which were an order of magnitude more than measurements made by the fixed air quality monitoring station located 1.35 km away. Pedestrians are advised to consider walking routes a street back from busy main roads to reduce their exposure.
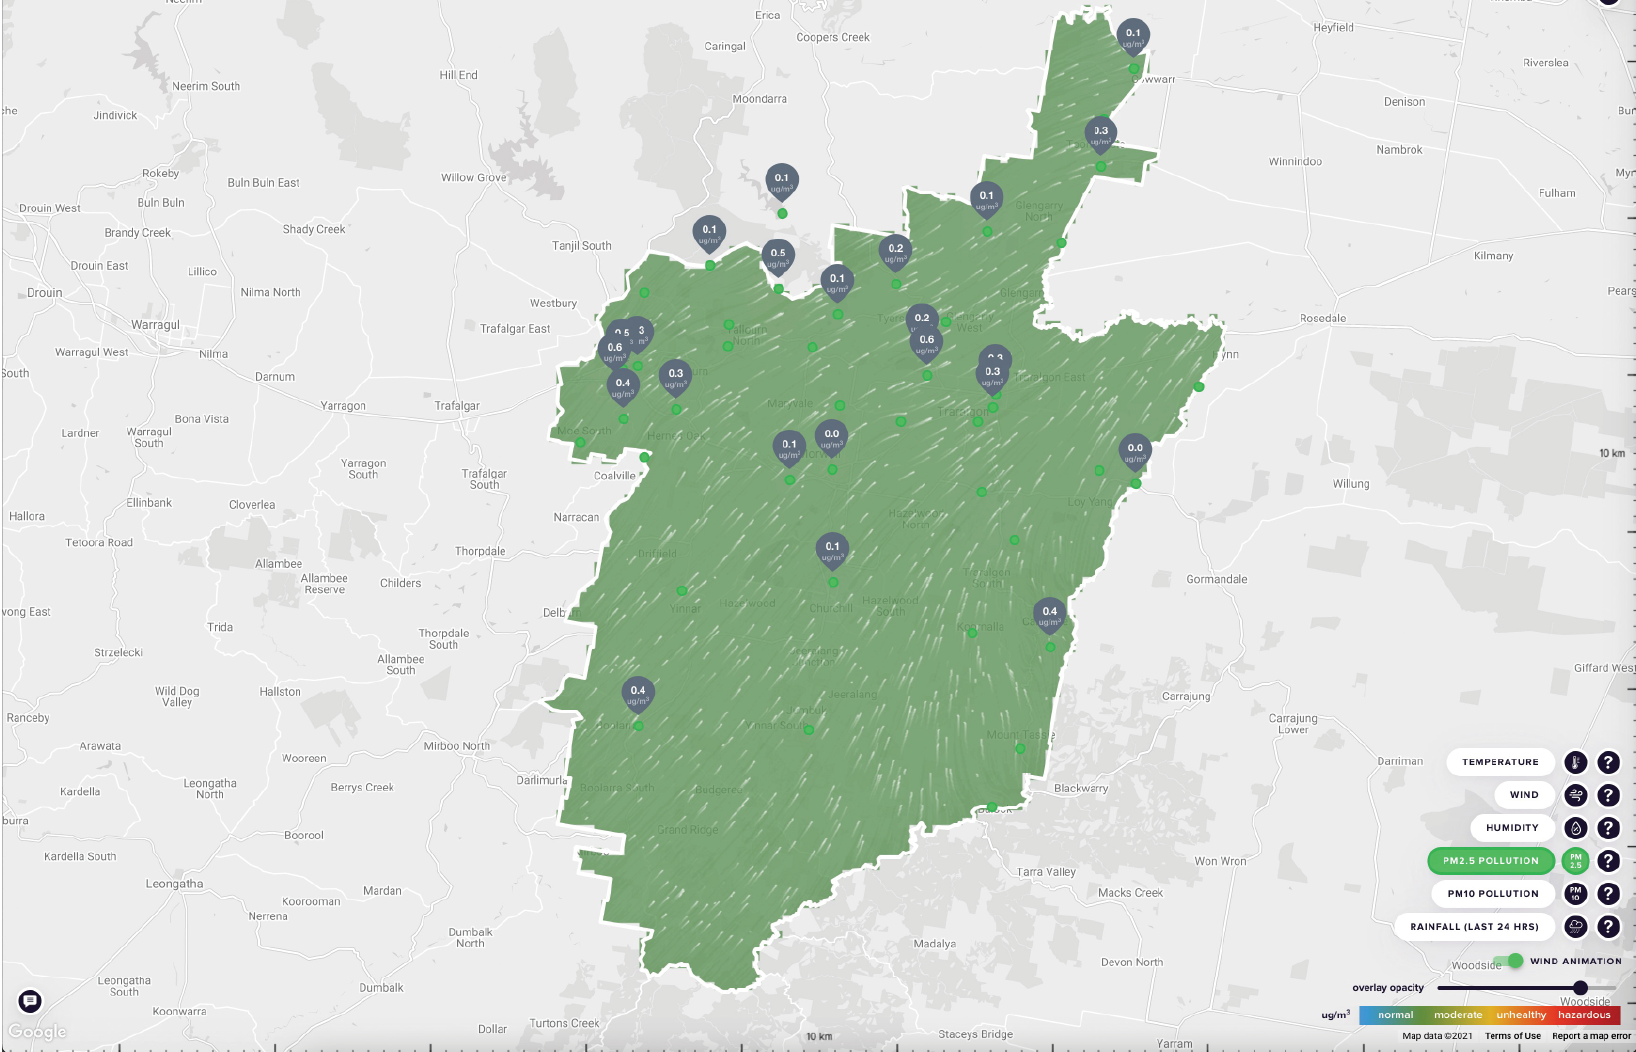
The Latrobe Valley Information Network placed 45 sensors around this industrialised region of Victoria (Figure 52). The Latrobe Valley is home to several power stations and the location of the Hazelwood mine fire in 2014. Air quality continues to be a concern for residents. The sensors measure PM and meteorological variables such as temperature and wind speed. The aim of the network is to provide an early indication of air quality problems to residents so that they can take action (shutting doors and windows, and sheltering inside).
Engaging students
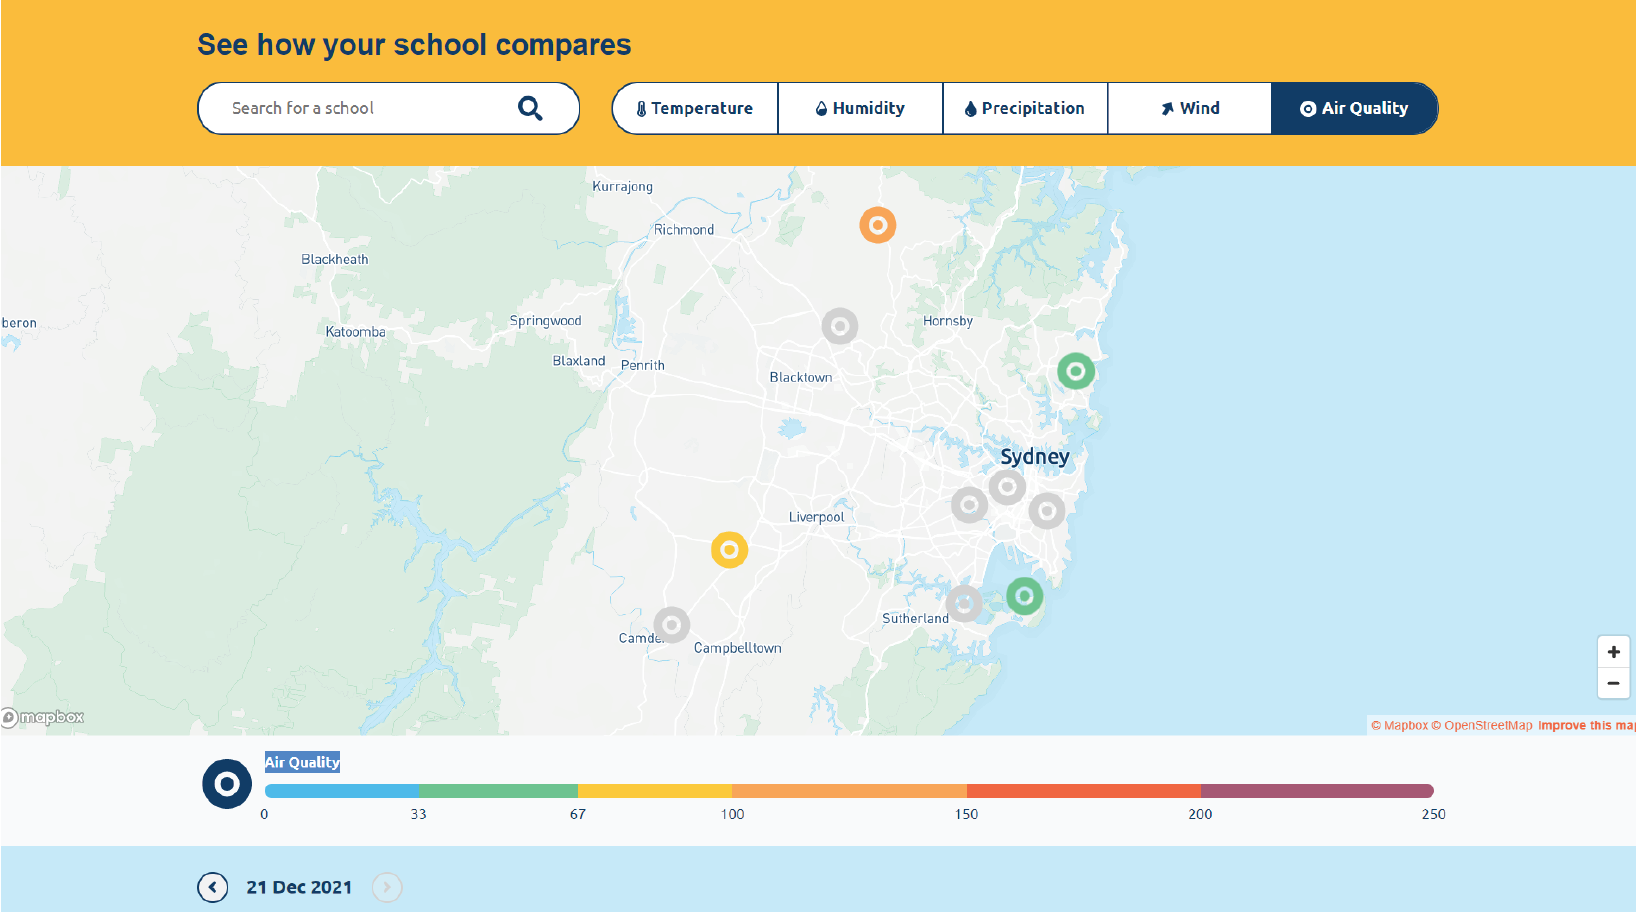
Encouraging students’ interest in air quality is a welcome addition to Australian curriculums. The Schools Weather and Air Quality (SWAQ) project was instigated by the University of New South Wales to study how increased urbanisation affected local pollution in 7 schools around the suburbs of Sydney. SWAQ equipped the schools with air quality sensors to gather local data. Students were involved in designing how the data are visualised on the SWAQ data portal (Figure 53) and will analyse the data in curriculum-aligned classroom activities.
Smoke observation gadgets (SMOGs) were designed by CSIRO to be simple and robust enough for students to build themselves and deploy at home. In regional Victoria, students are measuring the local impacts of smoke from planned burning. They discovered that particle concentrations were high during burn-offs, and that high smoke levels and elevated humidity worsened their asthma symptoms. Students kept a diary of home activities such as lighting fires or barbecuing, and could see the impacts on the SMOGs immediately from the traffic-light display indicating the particle concentrations (Figure 54). Students enjoyed building the SMOG kits and taking ownership of the data analyses.


