Parent assessment Child assessments Method Above- and below-ground carbon Above- and below-ground carbon in intensive land-use zone Results are reported by land-use intensity zones (Figure 6). Assessment is based on evidence in Carbon. Above- and below-ground carbon in extensive land-use zone Above- and below-ground carbon in relatively natural zone Definition of assessment ratings: Very good: Carbon stocks exceed the minimum expected to maintain or enhance natural capital values. Good: Carbon stocks meet the minimum expected to maintain natural capital values. Poor: Carbon stocks do not meet the minimum expected. Natural capital values are reduced. Very poor: Carbon stocks are depleted. Natural capital values have been lost. For more information, go toApproach Share on Twitter Share on Facebook Share on Linkedin Share this link
Parent assessment Child assessments Method for assessment Native vegetation extent and condition Native vegetation extent and condition in intensive land-use zone Results are reported by land-use intensity zones (Figure 6). Assessment is based on evidence in Native vegetation. Extent is assessed by patterns of modification, using National Vegetation Information System (NVIS) present Major Vegetation Groups (MVGs) version 6.0. Patterns of ecosystem condition were informed by Habitat Condition Assessment System version 2.1 outputs, mostly by pre-1750 NVIS MVGs version 6.0 (and the box plots for present MVGs – Figure 7). Native vegetation extent and condition in extensive land-use zone Native vegetation extent and condition in relatively natural zone Definition of assessment ratings: Very good: Extent and condition of native vegetation exceed the minimum expected to maintain or enhance natural capital values. Good: Extent and condition of native vegetation meet the minimum expected to maintain natural capital values. Poor: Extent and condition of native vegetation do not meet the minimum expected. Natural capital values are reduced. Very poor: Native vegetation has been removed. Natural capital values have been lost. For more information, go toApproach Share on Twitter Share on Facebook Share on Linkedin Share this link
Parent assessment Child assessments Method for assessment Soil health Soil health in intensive land-use zone Results are reported by land-use intensity zones (Figure 6). Assessment is based on evidence in Soil. Soil health in extensive land-use zone Soil health in relatively natural zone Definition of assessment ratings: Very good: Soil quantity and quality exceed the minimum expected to maintain or enhance natural capital values. Good: Soil quantity and quality meet the minimum expected to maintain natural capital values. Poor: Soil quantity and quality do not meet the minimum expected. Natural capital values are reduced. Very poor: Soil quantity and quality are depleted. Natural capital values have been lost. For more information, go toApproach Share on Twitter Share on Facebook Share on Linkedin Share this link
Expand View Figure 19 Annual area of vegetation burned (bushfire or prescribed) by type (forest, grassland, wetlands) and biome (temperate, tropical, subtropical and semi-arid) in Australia, 1990–2019 Note: Data for the extensive bushfires in early 2020 were not available in the activity tables, but an extensive analysis is provided in DISER (2020b). Source: Land use, land-use change and forestry Activity Tables 16–17 (DISER 2021a) Download Go to data.gov For more information, go toCarbon Share on Twitter Share on Facebook Share on Linkedin Share this link
Expand View Figure 19 Annual area of vegetation burned (bushfire or prescribed) by type (forest, grassland, wetlands) and biome (temperate, tropical, subtropical and semi-arid) in Australia, 1990–2019
Expand View Figure 9 A national perspective on habitat condition for terrestrial biodiversity, showing the continuous site-level score in 5 classes that approximate the VAST narrative framework HCAS = Habitat Condition Assessment System; VAST = Vegetation Assets, States and Transitions Notes: HCAS estimates departure from reference (intact ecosystems) as depicted by the MODIS (Moderate Resolution Imaging Spectroradiometer) satellite remote sensing of vegetation cover for 250 × 250-metre pixels. HCAS scores less than 0.4 potentially represent places where some dominant structuring plant species indigenous to the locality may still be present but the land is largely under some form of cultivation. At lower scores (<0.2) the indigenous species have most likely been replaced by some form of intensive land use. Excluded: water bodies, salt lakes. Sources: Williams et al. (2021b), Harwood et al. (2021b); map projection: Australian Albers GDA94 (ICSM n.d.) For more information, go toNative vegetation Share on Twitter Share on Facebook Share on Linkedin Share this link
Expand View Figure 9 A national perspective on habitat condition for terrestrial biodiversity, showing the continuous site-level score in 5 classes that approximate the VAST narrative framework
Expand View Figure 15 Australian carbon budget, including natural and human-caused carbon dioxide sources and sinks (and their net effect in the atmosphere), 2010–19 CO2 = carbon dioxide; Mt = megatonne; yr = year Notes: Fossil fuel emissions are based on the National Greenhouse Gas Inventory. Biospheric fluxes are based on the CABLE land surface model, which takes into account the impact of increasing CO2 levels and changing climate on plant growth and soils. Fire emissions are from Global Fire Emissions Database (Haverd et al. 2018, Villalobos et al. 2021). Annual fluxes are the average for the 2010–19 decade. Units are in million tonnes of CO2. Source: Canadell (2021) For more information, go toCarbon Share on Twitter Share on Facebook Share on Linkedin Share this link
Expand View Figure 15 Australian carbon budget, including natural and human-caused carbon dioxide sources and sinks (and their net effect in the atmosphere), 2010–19
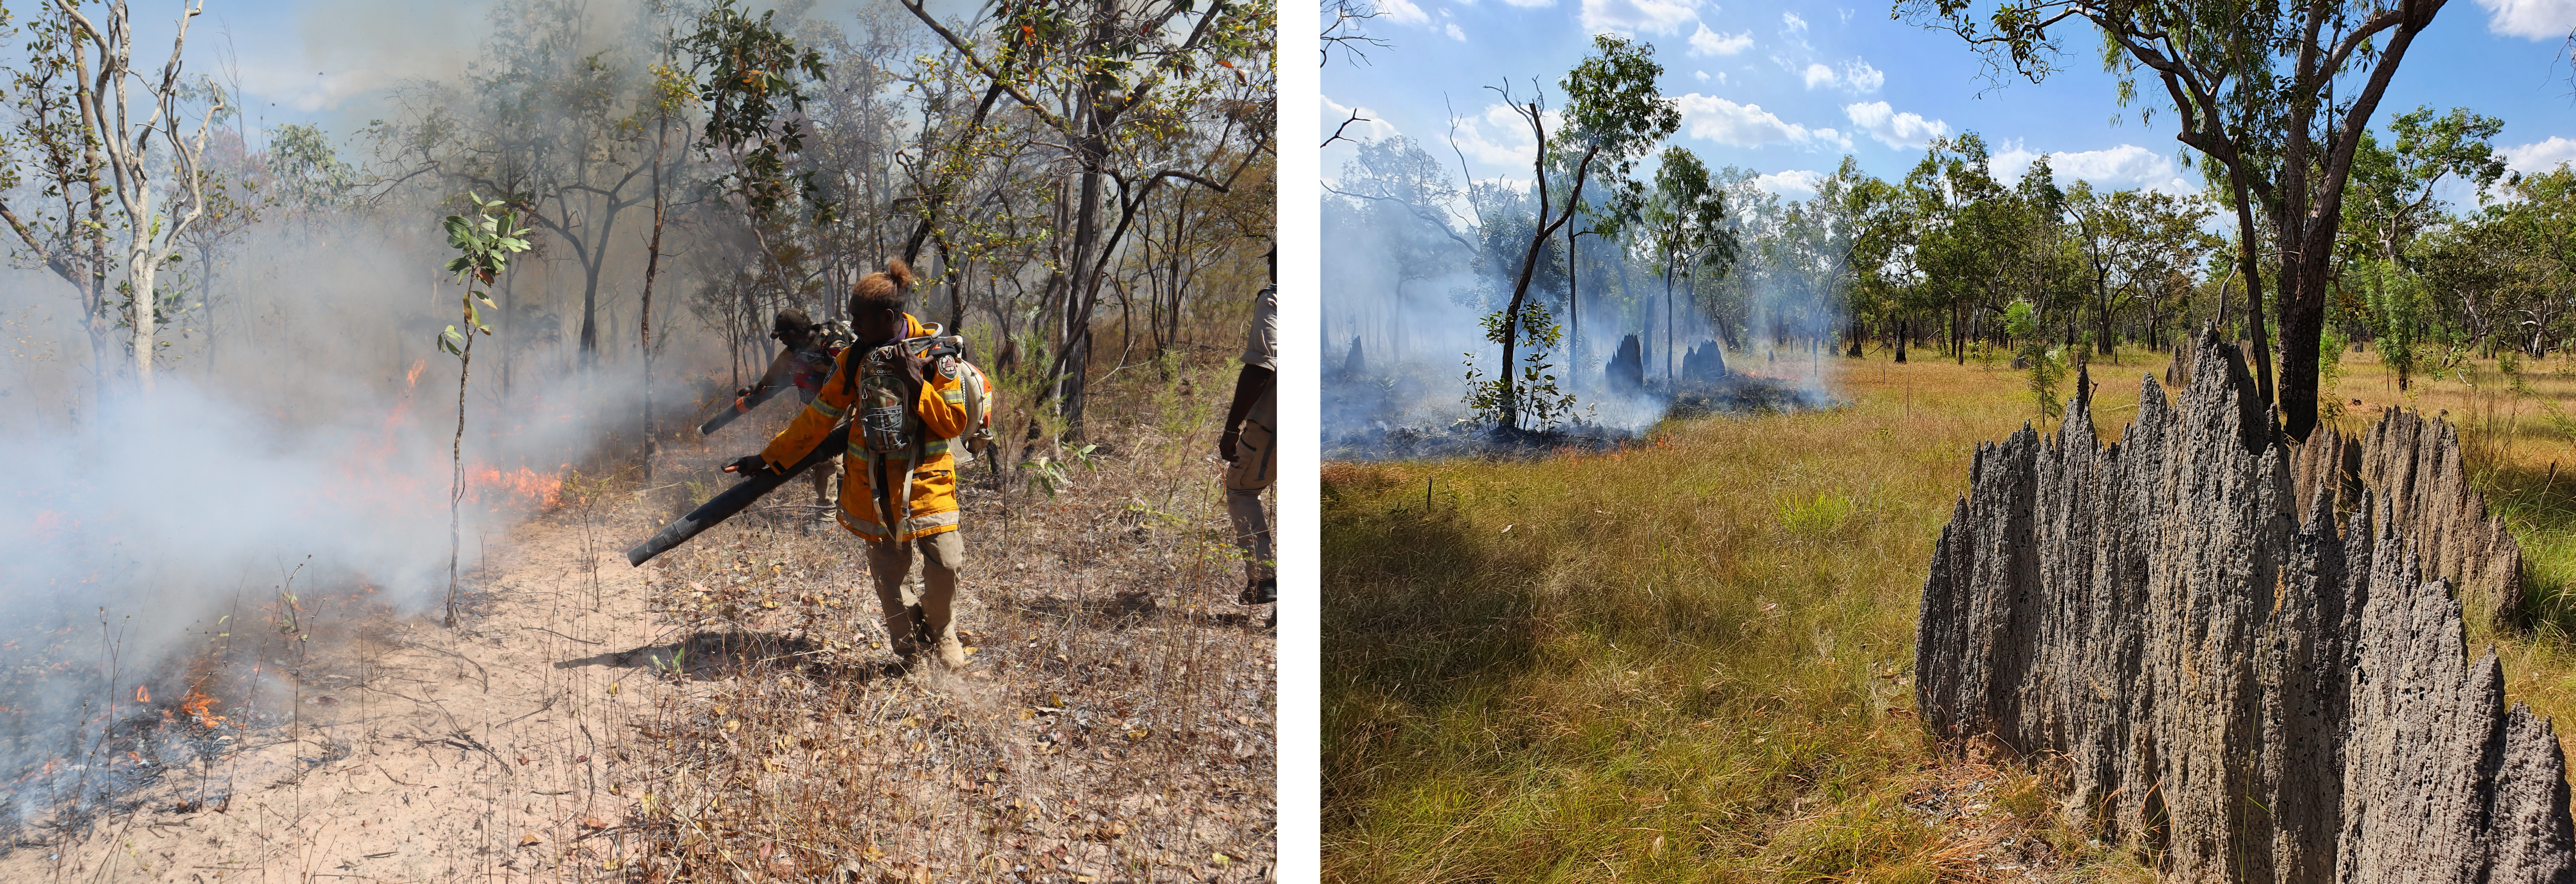
Expand View Figure 71 Backpack leaf blowers have become essential equipment for managing kilometres of fire front (left). Cool fires burning through savanna woodland marked with termite mounds (right) Photos: Warddeken Land Management Limited For more information, go toManagement approaches Share on Twitter Share on Facebook Share on Linkedin Share this link
Expand View Figure 71 Backpack leaf blowers have become essential equipment for managing kilometres of fire front (left). Cool fires burning through savanna woodland marked with termite mounds (right)
Soil classification order Vulnerability to soil organic carbon loss (index) Extent of soil class (hectares, thousands) Extent of soil class as a percentage of extent of all Australian soils Percentage of extent of soil class modified by land use Minimum Mean Maximum Organosols 0.34 0.84 1.29 1,253 0.16 4.4 Podosols 0.28 0.66 1.44 1,887 0.25 39.9 Kurosols 0.26 0.65 1.44 11,120 1.45 44.9 Ferrosols 0.24 0.53 1.39 5,883 0.77 24.2 Dermosols 0.20 0.50 1.48 23,302 3.04 25.1 Anthroposols 0.31 0.49 1.00 44 0.01 100.0 Chromosols 0.20 0.43 1.43 41,172 5.37 41.2 Sodosols 0.19 0.41 1.49 55,636 7.25 35.8 Hydrosols 0.19 0.40 1.42 22,553 2.94 7.8 Kandosols 0.19 0.40 1.45 163,421 21.30 11.9 Tenosols 0.19 0.40 1.54 113,294 14.77 3.3 Rudosols 0.19 0.39 1.48 155,505 20.27 1.7 Calcarosols 0.18 0.37 1.24 69,936 9.12 10.0 Vertosols 0.18 0.30 1.33 102,249 13.33 19.9 Note: Vulnerability is an index derived from the ratio of particulate organic carbon (POC) to the sum of humus (HOC) and resistant organic carbon (ROC). Sources: Soil organic carbon loss vulnerability (Viscarra Rossel et al. 2019b, Viscarra Rossel et al. 2019a); Australian soil classification national grid available from the Australian Collaborative Land Evaluation Program (ACLEP: CSIRO 2021a); soil classification orders (Isbell 2002) interpreted by Ashton & McKenzie (2001) from the digital atlas compiled by the Bureau of Rural Sciences (2000) from scans of the original mapping by Northcote et al. (1968). Percentages modified by land use (vegetation clearing) in each soil classification order derive from extant Major Vegetation Groups in National Vegetation Information System v6.0 (DAWE 2020g), as shown in Figure 12. For more information, go toCarbon Share on Twitter Share on Facebook Share on Linkedin Share this link
Parent assessment Child assessments Method for assessment Management of natural capital assets and pressures Management of protected areas Assessment is based on evidence in Protected areas. Indigenous-managed lands Assessment is based on evidence in Indigenous land management. Management of native vegetation Assessment is based on evidence in Retaining and restoring natural capital assets. Management of soils Management of carbon Management of invasive species Assessment is based on evidence in Invasive species. Definition of assessment ratings: Very effective: Management measures maintain or improve state of natural capital. Land environment values are considered secured against known pressures. Effective: Management measures maintain or improve state of natural capital, but pressures remain as significant factors that degrade land environment values. Partially effective: The expected impacts of management measures on improving state of natural capital are yet to be seen. Pressures continue to degrade land environment values. Ineffective: Despite management measures, state of natural capital is still poor or continuing to decline. Unmitigated pressures continue to significantly degrade land environment values. For more information, go toApproach Share on Twitter Share on Facebook Share on Linkedin Share this link
Expand View Figure 8 Extent of modification of MVGs HCAS = Habitat Condition Assessment System; MVG = major vegetation group; NVIS = National Vegetation Information System Notes: Assessed using HCAS v2.1 (see case study: Assessing condition of habitat consistently and nationally). Condition scores are aggregated in 5 classes of 0.2 increments for comparison with Figure LAN30 in the 2016 state of the environment report (Metcalfe & Bui 2017), and related to the Vegetation Assets, States and Transitions (VAST) framework narrative (Thackway & Lesslie 2006) to guide interpretation: residual, modified, transformed, replaced, removed. NVIS v6.0 pre-1750 MVGs not shown: Mangroves; Inland Aquatic – freshwater, salt lakes, lagoons; Unclassified native vegetation; Unclassified forest; Unknown/no data. HCAS v2.1 condition scores do not apply to these MVGs. Excluded from analysis: commercial plantation forestry – defined by MPIGA & NFISC (2018); inland water bodies and salt lakes – defined by ‘AHGFWaterbodyLargest’ polygon in BOM (2012); and the Water Observations from Space dataset over the period 2001–14 indicating >80 water presence (GA 2015). These areas did not contribute to the HCAS v2.1 summary statistics for each MVG. Sources: HCAS v2.1 (2001–18) described in Williams et al. (2021b); NVIS v6.0 pre-1750 MVGs from DAWE (2020h) Download Go to data.gov For more information, go toNative vegetation Share on Twitter Share on Facebook Share on Linkedin Share this link