Graphs, maps and tables

Showing results 21 - 30 of 50
Figure 14 Agricultural land in Australia protected from wind erosion, 2009–10 and 2019–20

Note: The percentage of Australia’s agricultural land protected from wind erosion each month is shown for 2009–10 and 2019–20, compared with the range of monthly values between 2001 and 2018. Agricultural land is considered protected from wind erosion when each pixel has at least 50% total vegetation cover.

Source: Howorth et al. (2020)

Figure 57 Annual variation in the percentage cumulative land area in different IUCN protected area management categories since 1997

IUCN = International Union for Conservation of Nature; NRS = National Reserve System

  1. Data for 1997 give the cumulative status as at the end of 1997.

Notes:

  1. Includes areas assessed for inclusion in the NRS that are awaiting formal gazettal (post 30 June 2020) and NRS properties, excluding Antarctic properties. Data based on NRS properties derived from DAWE (2021ab), where NRS_PA = I (interim; pending gazettal) or Y (yes, excluding Antarctic properties).
  2. Undated properties are mainly private conservation areas.
  3. Protected area management categories follow Dudley (2013). Unknown categories for conservation covenants were assumed to be Category IV. Not applicable categories are excluded.

Source: DAWE (2021ab)

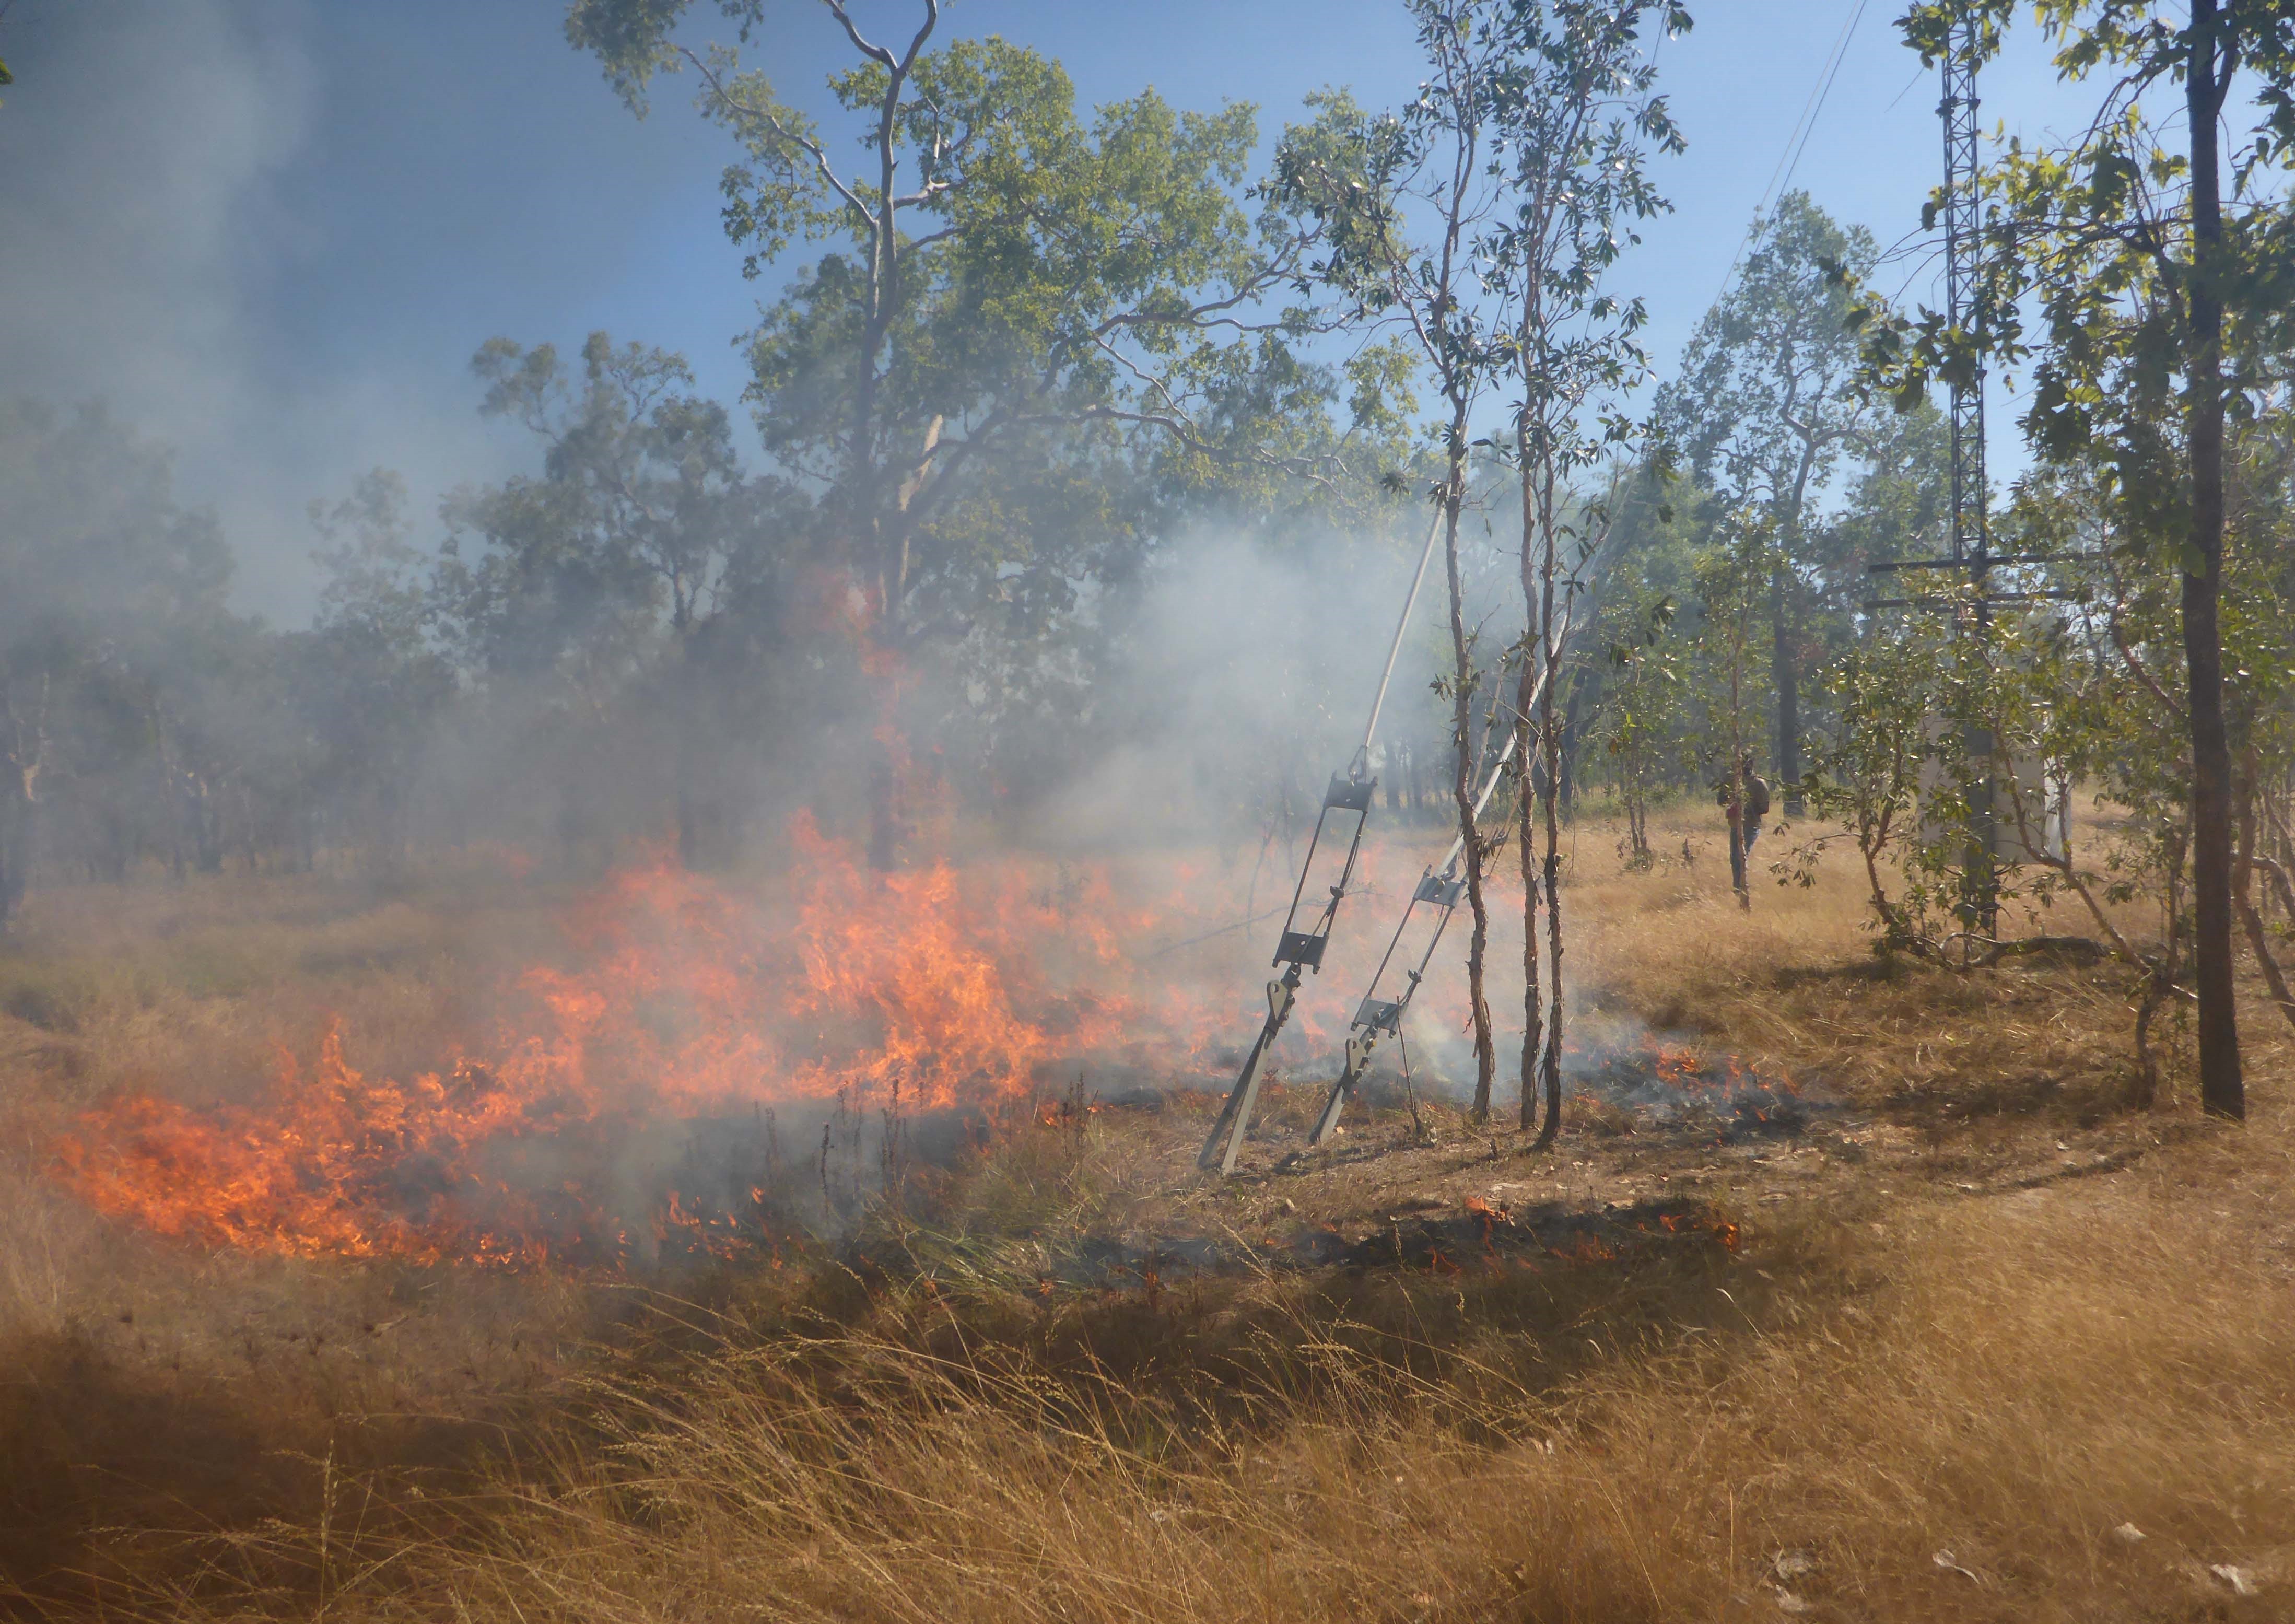
Figure 79 On-ground mosaic control burn in savanna, a Land Restoration Fund project near Pormpuraaw, Cape York
Figure 81 New digital soil map of Australia’s soil orders made possible using the SoilDataFederator
Figure 41 Extent of woody and nonwoody vegetation loss on rural regulated land by authorising Act, 2017–19

Note: Authorised clearing applies under the repealed Native Vegetation Act 2003 (NV Act), the Local Land Services Act 2013 (LLS Act) or other Acts (Plantation and Reafforestation Act 1999, Environmental Planning and Assessment Act 1979). Unexplained clearing refers to areas of vegetation loss on rural regulated land defined by the LLS Act for which the Department of Planning, Industry and Environment does not yet know the details.

Source: Adapted from Figure 1 in DPIE (2021c)

Figure 12 Extent of modification of Australian soil classification orders, as assessed using the cleared and regrowth or modified areas from the mapping of extant MVGs

MVG = major vegetation group

Notes:

  1. Categories in legend are based on extant MVGs in the National Vegetation Information System v6.0 (DAWE 2020g):
    ‘Vegetation’ is extant terrestrial native vegetation, including Naturally bare – sand, rock, claypan, mudflat.
    ‘Aquatic’ is the following MVG: Inland Aquatic – freshwater, salt lakes, lagoons.
    ‘Cleared’ is the following MVG: Cleared, non-native vegetation, buildings.
    ‘Regrowth/modified’ is the following MVG: Regrowth, modified native vegetation.
    ‘Not applicable’ is Sea and estuaries, and Unknown/no data.
  2. Excluded soil map classification types (see Figure 11): Anthroposols, Rock, Lakes and no data.

Source: Soil classification orders (Isbell 2002) interpreted by Ashton & McKenzie (2001) from the digital atlas compiled by the Bureau of Rural Sciences (2000) from scans of the original mapping by (Northcote et al. (1968))

Figure 72 Bininj Traditional Owner women in Kakadu National Park using the Healthy Country AI interactive data dashboard to explore changes to weed coverage after management
Figure 70 Erosion control programs have trialled a range of techniques in Great Barrier Reef catchments; rock capping of erodible soils and check dams have been used to help revegetate this site on Cape York Peninsula
Table 19 Assessment method for management of the terrestrial environment and resources to support human wellbeing

Parent assessment

Child assessments

Method for assessment

Management of the terrestrial environment and resources to support human wellbeing

Not applicable

Assessment is based on evidence in Indigenous land managers and rangers, Farmers and graziers and Landcare volunteers

Definition of assessment ratings:

Very effective: Land management measures maintain or improve wellbeing of people and communities. Life quality and satisfaction are considered secured against known pressures on land environmental values.

Effective: Land management measures maintain or improve wellbeing of people and communities, but pressures on land environmental values remain as significant factors affecting life quality and satisfaction.

Partially effective: The expected impacts of land management measures on improving wellbeing of people and communities are yet to be seen. Pressures on land environmental values remain as significant factors influencing life quality and satisfaction.

Ineffective: Despite land management measures, wellbeing of people and communities is still poor or continuing to decline. Unmitigated pressures on land environmental values remain as significant factors influencing life quality and satisfaction.

Table 17 Assessment method for pressures that degrade natural capital

Parent assessment

Child assessments

Method for assessment

Pressures that degrade natural capital

Climate change–induced impacts

Assessment is based on evidence in Climate change and other sections that may touch on climate variability and change.

Land clearing

Assessment is based on evidence in Land clearing.

Production and intensive land use

Assessment is based on evidence in Land use – particularly changes in land use from 2010–11 to 2015–16 as reported in land accounts published 29 September 2021 (ABS 2021e, ABS 2021b) (see case study: The National Land Account, experimental estimates (2011–16).

Invasive species

Assessment is based on evidence in Introduced and invasive species – particularly data aggregated by the Atlas of Living Australia from multiple sources as of September 2021, including Terrestrial Ecosystem Research Network survey and monitoring data, and Global Register of Introduced and Invasive Species – Australia (EcoAssets 2021).

Definition of assessment ratings:

Very high impact: Pressures strongly degrade state of natural capital in the land environment, over a large extent and with high severity.

High impact: Pressures moderately degrade state of natural capital in the land environment, over a moderate extent and/or with moderate severity.

Low impact: Pressures minimally degrade state of natural capital in the land environment, over a small extent and/or with low severity.

Very low impact: Pressures do not degrade, or only negligibly degrade, the state of natural capital in the land environment.