Scott Wilkinson and Rebecca Bartley, CSIRO As shown in the 2016 state of the environment report, land management can reduce sediment and pollutant delivery to the Great Barrier Reef lagoon (see Box LAN7 in Metcalfe & Bui 2017). Since then, researchers have made considerable progress in understanding the source areas and processes delivering sediment to the Great Barrier Reef (Bartley et al. 2014, Lewis et al. 2021, and references therein). Gully erosion has been identified as the largest sediment source, while denuded hillslope areas and eroding stream banks are also important contributors in some catchments. A critical gap in understanding has been the design and effectiveness of erosion remediation options for controlling the dominant sources of sediment from gullies, and how this translates to improved water quality at property and subcatchment scales. Recently completed projects have tested the mechanisms by which specific rehabilitation techniques are effective at reducing sediment yields (Doriean et al. 2021, Koci et al. 2021). Key findings include: Sites that have large erosion rates, soils with high silt and clay content, and that deliver sediment efficiently downstream to the lagoon are the more cost-effective to treat (assuming the treatment costs are equal): (e.g. Figure 66) New developments in landscape terrain analysis using airborne LiDAR (light detection and ranging) data are enabling more accurate assessment of gully characteristics (e.g. Walker et al. 2020) (Figure 67) while information on site-scale gully erosion rates is more limited and depends on analysis of historic air photos. Site monitoring can greatly improve the confidence in sediment load reductions from erosion control and inform adaptive management. Monitoring may include measuring the soil silt and clay content at the site, measuring changes in water quality over time, and measuring changes in vegetation to provide an early indication of improved landscape condition (e.g. Figures 68–69). While gully erosion control can be focused on the most active gullies, achieving Great Barrier Reef water quality targets at river basin scale will require much larger investments than have been undertaken to date (e.g. Figure 70). Figure 66 Erosion control projects that rehabilitate large and active gullies (left – before; right – after) well connected to river systems are the most effective at improving water quality in the Great Barrier Reef lagoon Expand View Figure 66 Erosion control projects that rehabilitate large and active gullies (left – before; right – after) well connected to river systems are the most effective at improving water quality in the Great Barrier Reef lagoon Photos: NQ Dry Tropics and Queensland Government Landholders Driving Change Program Source: Figure 67 in Bartley et al. (2020). Used with permission. Figure 67 A digital elevation model was derived from LiDAR data (a), showing information on the extent and location of current incised channel features (purple areas in b), and on locations where risks of incision may occur in the future (dark green areas – c); panel d combines b and c (blue boxes are different examples of gully erosion) Expand View Figure 67 A digital elevation model was derived from LiDAR data (a), showing information on the extent and location of current incised channel features (purple areas in b), and on locations where risks of incision may occur in the future (dark green areas – c); panel d combines b and c (blue boxes are different examples of gully erosion) Note: Automated classification procedures based on fine-resolution digital elevation models are now providing these assessments in priority areas of Great Barrier Reef catchments. Source: Figure 7 in Walker et al. (2020) of a cleared area on sodic soils (Goodnight Scrub, 25°14′S, 151°53′E). Figure 68 Site monitoring of water quality has used a controlled experimental design to compare water quality from rehabilitated and untreated gullies using automated monitoring equipment Expand View Figure 68 Site monitoring of water quality has used a controlled experimental design to compare water quality from rehabilitated and untreated gullies using automated monitoring equipment Photo: Scott Wilkinson, CSIRO Figure 69 A gully in the Burdekin River basin (left) that has been reshaped and revegetated (right) through a partnership between the Queensland Government and Greening Australia Expand View Figure 69 A gully in the Burdekin River basin (left) that has been reshaped and revegetated (right) through a partnership between the Queensland Government and Greening Australia Note: Large gullies can individually supply considerable fine sediment to river systems and the Great Barrier Reef lagoon. Compared with an adjacent untreated gully, sediment concentrations declined by more than 90% in the following years. Photo: Damon Telfer, Fruition Environmental Pty Ltd, 2021 Figure 70 Erosion control programs have trialled a range of techniques in Great Barrier Reef catchments; rock capping of erodible soils and check dams have been used to help revegetate this site on Cape York Peninsula Expand View Figure 70 Erosion control programs have trialled a range of techniques in Great Barrier Reef catchments; rock capping of erodible soils and check dams have been used to help revegetate this site on Cape York Peninsula Note: Work was supported by the Australian Government’s Reef Trust. Photo: Scott Wilkinson, CSIRO For more information, go toManagement approaches Share on Twitter Share on Facebook Share on Linkedin Share this link
Expand View Figure 66 Erosion control projects that rehabilitate large and active gullies (left – before; right – after) well connected to river systems are the most effective at improving water quality in the Great Barrier Reef lagoon Photos: NQ Dry Tropics and Queensland Government Landholders Driving Change Program Source: Figure 67 in Bartley et al. (2020). Used with permission.
Expand View Figure 66 Erosion control projects that rehabilitate large and active gullies (left – before; right – after) well connected to river systems are the most effective at improving water quality in the Great Barrier Reef lagoon
Expand View Figure 67 A digital elevation model was derived from LiDAR data (a), showing information on the extent and location of current incised channel features (purple areas in b), and on locations where risks of incision may occur in the future (dark green areas – c); panel d combines b and c (blue boxes are different examples of gully erosion) Note: Automated classification procedures based on fine-resolution digital elevation models are now providing these assessments in priority areas of Great Barrier Reef catchments. Source: Figure 7 in Walker et al. (2020) of a cleared area on sodic soils (Goodnight Scrub, 25°14′S, 151°53′E).
Expand View Figure 67 A digital elevation model was derived from LiDAR data (a), showing information on the extent and location of current incised channel features (purple areas in b), and on locations where risks of incision may occur in the future (dark green areas – c); panel d combines b and c (blue boxes are different examples of gully erosion)
Expand View Figure 68 Site monitoring of water quality has used a controlled experimental design to compare water quality from rehabilitated and untreated gullies using automated monitoring equipment Photo: Scott Wilkinson, CSIRO
Expand View Figure 68 Site monitoring of water quality has used a controlled experimental design to compare water quality from rehabilitated and untreated gullies using automated monitoring equipment
Expand View Figure 69 A gully in the Burdekin River basin (left) that has been reshaped and revegetated (right) through a partnership between the Queensland Government and Greening Australia Note: Large gullies can individually supply considerable fine sediment to river systems and the Great Barrier Reef lagoon. Compared with an adjacent untreated gully, sediment concentrations declined by more than 90% in the following years. Photo: Damon Telfer, Fruition Environmental Pty Ltd, 2021
Expand View Figure 69 A gully in the Burdekin River basin (left) that has been reshaped and revegetated (right) through a partnership between the Queensland Government and Greening Australia
Expand View Figure 70 Erosion control programs have trialled a range of techniques in Great Barrier Reef catchments; rock capping of erodible soils and check dams have been used to help revegetate this site on Cape York Peninsula Note: Work was supported by the Australian Government’s Reef Trust. Photo: Scott Wilkinson, CSIRO
Expand View Figure 70 Erosion control programs have trialled a range of techniques in Great Barrier Reef catchments; rock capping of erodible soils and check dams have been used to help revegetate this site on Cape York Peninsula
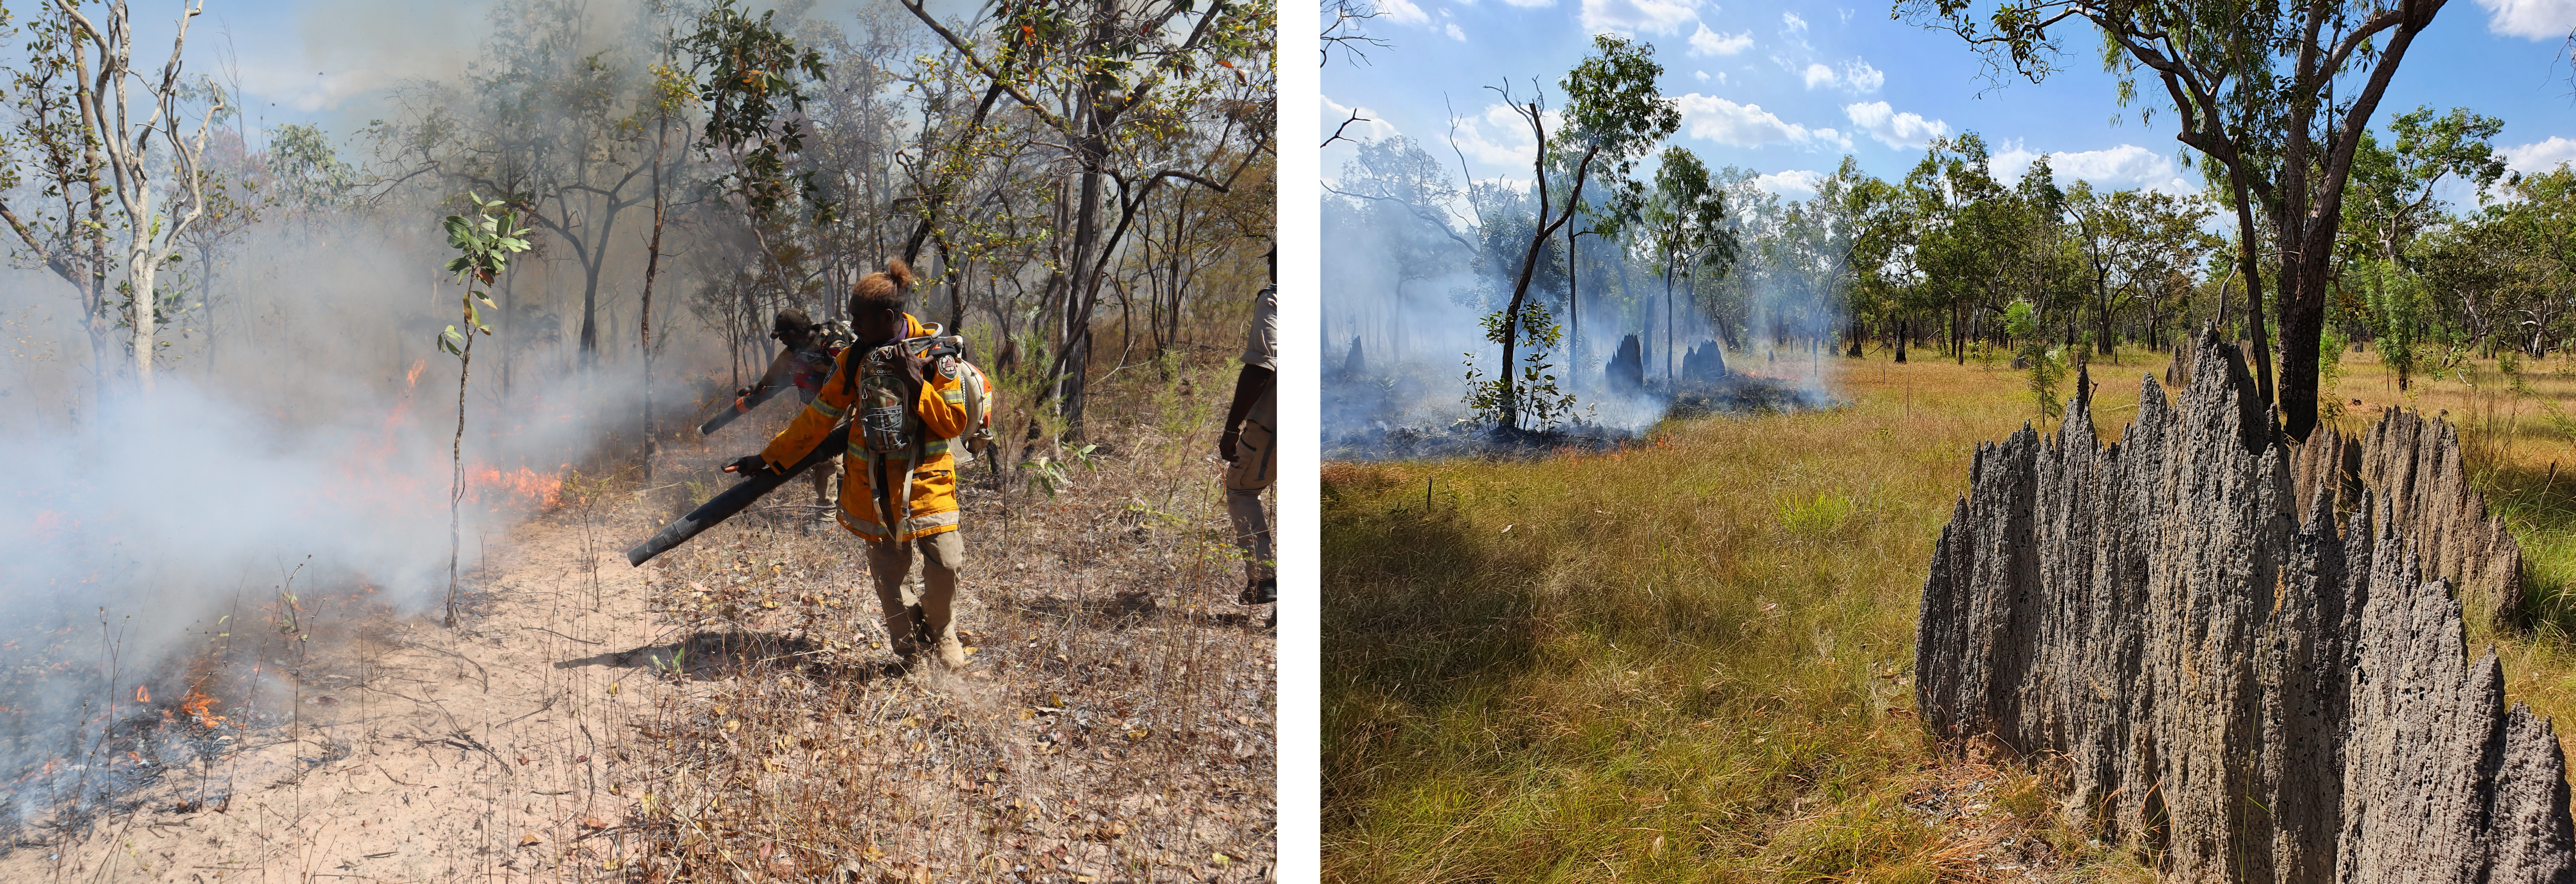
Jennifer Ansell, Chief Executive Officer, Arnhem Land Fire Abatement Northern Territory Savanna fire is a major source of global greenhouse gas emissions. In Australia, Aboriginal people have been using fire to manage the Australian landscape for thousands of years. Following European colonisation and the displacement of Aboriginal people from their clan estates, Aboriginal fire management began to break down across much of northern Australia. Fire regimes became dominated by wildfires in the late dry season. Large and environmentally destructive, these wildfires also contribute significantly to Australia’s greenhouse gas emissions. Since 2012, the Savanna Fire Management Methodology has been operating under Australia’s Emissions Reduction Fund – the first legal instrument of this kind at a global level (Maraseni et al. 2016). Indigenous land and sea management rangers operating in the remote tropical savannas of northern Australia are leading the adoption of this unique methodology to proactively reduce or avoid greenhouse gas emissions through the management of fire, and, in doing so, helping Australia meet its emissions reporting targets. In Arnhem Land, the Adjumarllarl, Arafura Swamp, Djelk, Jawoyn, Mimal, Numbulwar Numburindi, Warddeken, Yirralka and Yugul Mangi ranger groups work with Traditional Owners to deliver fire management within 5 registered eligible carbon offset projects encompassing 80,000 square kilometres of diverse Indigenous estate in northern Australia (Altman et al. 2020, Ansell et al. 2020). Their fire management aims to reduce large, hot, uncontrolled fires burning at the end of the dry season, by creating a mosaic of burnt and unburnt areas of land early in the dry season when there is sufficient moisture, low winds and heavy dews to control burns effectively (WLM 2021). The Savanna Fire Management Methodology calculates the avoided greenhouse gas emissions during each project year compared with project emissions during a pre-project, 10-year baseline period. Aboriginal engagement with the carbon industry in this region is supported by ALFA (NT) Limited (Arnhem Land Fire Abatement). This Aboriginal-owned organisation coordinates commercial management and markets the remunerated carbon emissions reductions this activity generates, while operating as a charitable entity to ensure that its earnings benefit the Aboriginal landowners of Arnhem Land (Altman et al. 2020). The ALFA program has built on lessons learned during the development and operation of the West Arnhem Land Fire Abatement (WALFA) project, which was initiated following discussions between Traditional Owners and non-Aboriginal fire scientists in the late 1990s (Russell-Smith et al. 2009, Whitehead et al. 2014). In 2006, the WALFA project saw ConocoPhillips and the Darwin liquefied natural gas facility work with the Northern Territory Government and the Northern Land Council to fund the work of 5 Aboriginal ranger groups over 2.8 million hectares to protect the environment and produce an annual carbon offset of at least 100,000 tonnes of greenhouse gases. The WALFA project was an extraordinary success and became the landscape-scale model on which the Savanna Fire Management Methodology under the Australian Government’s Emissions Reduction Fund is based (e.g. Figure 71). The Aboriginal and Torres Strait Islander Social Justice Commissioner (2008) noted that ‘an average of 40% of the WALFA project area was burnt each year in the absence of traditional fire regimes between 1995 and 2004; and the vast majority of these fires (being late dry-season fires) consequently represents fires that are very hot and damaging to the landscape.’ Since then, WALFA and the other fire project areas in Arnhem Land have demonstrated a significant decrease in the area of late-dry-season fires and a significant increase in the area of early-dry-season fires, which have also become smaller and more numerous (Ansell et al. 2020). WALFA has been registered as an eligible carbon offsets project with the Clean Energy Regulator since 2014 (ALFA NT 2014). Today, the WALFA project is a significant producer of Australian Carbon Credit Units and is currently in the top 5 highest producing projects across all methodologies in Australia. ALFA (NT) Limited, as a registered charity, has other related goals: supporting biodiversity conservation, improving the wellbeing of people with traditional Aboriginal connection to its project areas, alleviating poverty and assisting in education (Altman et al. 2020). While fire management in Arnhem Land is funded through engagement with the carbon market, it is undertaken to meet environmental, cultural, social and economic goals. To this end, Traditional Owners identified 6 aspirations from their fire management efforts (Ansell et al. 2020): to continue the healthy fire management of their Country; see fewer wildfires; protect biodiversity; protect culturally important sites; apply, maintain and transfer knowledge; and create carbon abatement. Figure 71 Backpack leaf blowers have become essential equipment for managing kilometres of fire front (left). Cool fires burning through savanna woodland marked with termite mounds (right) Expand View Figure 71 Backpack leaf blowers have become essential equipment for managing kilometres of fire front (left). Cool fires burning through savanna woodland marked with termite mounds (right) Photos: Warddeken Land Management Limited For more information, go toManagement approaches Share on Twitter Share on Facebook Share on Linkedin Share this link
Expand View Figure 71 Backpack leaf blowers have become essential equipment for managing kilometres of fire front (left). Cool fires burning through savanna woodland marked with termite mounds (right) Photos: Warddeken Land Management Limited
Expand View Figure 71 Backpack leaf blowers have become essential equipment for managing kilometres of fire front (left). Cool fires burning through savanna woodland marked with termite mounds (right)
Cathy Robinson, CSIRO; Justin Perry, North Australian Indigenous Land and Sea Management Alliance; Michael Douglas and Samantha Setterfield, University of Western Australia; Jennifer Macdonald, CSIRO and Charles Darwin University Indigenous land and sea managers are playing a critical role in managing the risk of plant and animal pests and diseases entering, emerging, establishing and spreading in Australia. The sparsely populated 10,000-kilometre-wide northern Australian coastline is recognised as a frontline for incursions of many exotic animal and plant pests and diseases. Since 2004, Indigenous ranger groups have been paid under fee-for-service arrangements to deliver important biosecurity services, and are playing an increasing role in protecting the environment by participating in animal, plant and aquatic health surveys, insect trapping/surveillance, plant host mapping, collection and destruction of biosecurity risk material, and biosecurity awareness activities in remote communities (DAWE 2020c). The number of ranger groups undertaking biosecurity activities increased by more than 50% between 2018 and 2020, with localised management underpinned by Indigenous knowledge (DAWE 2020c). Ongoing management of existing biosecurity risks is also core business for many Indigenous rangers nationwide, who are helping curb the impacts of introduced plants and animals on environmental, social, cultural and economic values (Adams et al. 2018, Maclean et al. 2021, Russell et al. 2021). To effectively combat the growing pressure of invasive non-native species, Indigenous rangers are adopting new technologies and approaches that weave western science with local Indigenous knowledge (Macdonald et al. 2021, Robinson et al. 2021). One initiative, the Healthy Country AI collaboration, is connecting ecological and social science, Indigenous knowledge and technology to support enhanced adaptive co-management (Schmidt 2021). For example, under the direction of Indigenous rangers, aerial drones are used to capture video footage across remote wetlands in Kakadu National Park. The images are then computer analysed to locate invasive species such as para grass (Urochloa mutica), water buffalo (Bubalus bubalis) and feral pigs (Sus scrofa). Data are interpreted using Indigenous knowledge, artificial intelligence from drone footage, data visualisations, Indigenous on-ground assessment and scientific research (Dickens et al. 2021). The results are made available to rangers through a dashboard, designed in partnership with Traditional Owners based on their cultural values and the season, to support real-time on-ground management (Figure 72). Figure 72 Bininj Traditional Owner women in Kakadu National Park using the Healthy Country AI interactive data dashboard to explore changes to weed coverage after management Expand View Figure 72 Bininj Traditional Owner women in Kakadu National Park using the Healthy Country AI interactive data dashboard to explore changes to weed coverage after management Photo: Cathy Robinson, CSIRO For more information, go toManagement of specific pressures Share on Twitter Share on Facebook Share on Linkedin Share this link
Expand View Figure 72 Bininj Traditional Owner women in Kakadu National Park using the Healthy Country AI interactive data dashboard to explore changes to weed coverage after management Photo: Cathy Robinson, CSIRO
Expand View Figure 72 Bininj Traditional Owner women in Kakadu National Park using the Healthy Country AI interactive data dashboard to explore changes to weed coverage after management
Northern Australia Aboriginal Kakadu Plum Alliance Despite the significant revenue generated by the rapidly growing Australian native foods and botanicals sector, only around 1% of the produce and monetary value of the entire bushfoods sector is generated by Indigenous people and communities (Mitchell & Becker 2019). This is a marginal proportion of benefit considering that much of the industry is built on Indigenous ecological knowledge (see the Bushfoods section in the Indigenous chapter). Many and various challenges and circumstances have resulted in Indigenous people being marginal beneficiaries of this industry, including ongoing appropriation of Indigenous knowledge in the development of new bushfood enterprises, and a lack of understanding and respect for Indigenous custodial rights, responsibilities and attachments to bushfood plant species (Woodward et al. 2019, Jarvis et al. 2021, Maclean et al. 2022) (see the Indigenous cultural and intellectual property section in the Indigenous chapter). Despite the challenges that Indigenous people face in developing enterprises based on bush products, the Traditional Owner–led bush products sector continues to grow and diversify. This establishing sector incorporates a wide range of enterprises developed from bushfoods; native plant–derived industries (e.g. seed harvesting, nurseries, cut flowers); and the development of botanicals-based products including bush medicines, essential oils, and health and beauty products. These enterprises result from the wild harvest, cultivation and enrichment planting of select native plants. One such example is the Kakadu plum (Terminalia ferdinandiana), also known as gubinge in the Kimberley region. This native fruit grows almost exclusively on Indigenous-held land across northern Australia, from the Kimberley to Arnhem Land. Aboriginal communities and families have been harvesting and using Kakadu plum for many millennia, accumulating detailed knowledge of the plant’s characteristics, growing patterns and uses (NAAKPA 2020). The Northern Australia Aboriginal Kakadu Plum Alliance (NAAKPA) is a consortium of Aboriginal enterprises involved in the harvest and processing of Kakadu plum across northern Australia (Figure 73). It aims to encourage ethical sourcing of native fruit by large-scale markets, while protecting the interests of Aboriginal communities and their traditional knowledge. The Indigenous Land and Sea Corporation (ILSC; see case study: Indigenous Land and Sea Corporation) has been a key supporter of the development of the Alliance, committing $448,000 in 2018–19 towards establishing an Indigenous-led Kakadu plum supply chain through their Kakadu Plum Project (ILSC 2019a). The project supports Indigenous community harvesting and processing enterprises, with the aim of providing greater Indigenous influence and control in the market, and maximising the flow of benefits back to Indigenous communities. According to NAAKPA, the growth of access and benefit-sharing arrangements in relation to Kakadu plum supply chains is being driven by nation states who are signatories to the Nagoya Protocol (for details about the protocol, see sCBD 2011). There is a growing need for ethical sourcing of Kakadu plum and provenance traceability, as demanded by consumers, as food fraud is becoming more prevalent in larger supply chains. The benefits for remote communities are obvious in creating an economy, income and employment in areas where there is a distinct lack of opportunities to otherwise achieve this. Figure 73 Harvesting mi marral (Kakadu plum) at Wadeye, Palngun Wurnangat Aboriginal Corporation, Northern Territory (left). Mamabulanjin Aboriginal Corporation (Western Australia) and Thamarrurr Development Corporation (Northern Territory) have freeze-dried Kakadu plum powder for wholesale (right) Expand View Figure 73 Harvesting mi marral (Kakadu plum) at Wadeye, Palngun Wurnangat Aboriginal Corporation, Northern Territory (left). Mamabulanjin Aboriginal Corporation (Western Australia) and Thamarrurr Development Corporation (Northern Territory) have freeze-dried Kakadu plum powder for wholesale (right) Photos: left – Northern Australia Aboriginal Kakadu Plum Alliance; right – Indigenous Land and Sea Corporation For more information, go toManagement of specific pressures Share on Twitter Share on Facebook Share on Linkedin Share this link
Expand View Figure 73 Harvesting mi marral (Kakadu plum) at Wadeye, Palngun Wurnangat Aboriginal Corporation, Northern Territory (left). Mamabulanjin Aboriginal Corporation (Western Australia) and Thamarrurr Development Corporation (Northern Territory) have freeze-dried Kakadu plum powder for wholesale (right) Photos: left – Northern Australia Aboriginal Kakadu Plum Alliance; right – Indigenous Land and Sea Corporation
Expand View Figure 73 Harvesting mi marral (Kakadu plum) at Wadeye, Palngun Wurnangat Aboriginal Corporation, Northern Territory (left). Mamabulanjin Aboriginal Corporation (Western Australia) and Thamarrurr Development Corporation (Northern Territory) have freeze-dried Kakadu plum powder for wholesale (right)
Gulkula Mining Company (Gulkula) was established in 2011 by the Gumatj Corporation. The venture is unique in that it is owned and run by and for the Yolngu people of East Arnhem Land, Northern Territory. The Indigenous enterprise engages in environmentally sensitive, sustainable practices underpinned by Traditional Owner values that prioritise Indigenous upskilling by working on Country, while minimising cultural and ecological impacts of mining operations (Figure 74) In establishing their own mining company, Traditional Owners are changing the narrative by taking direct control of the mining process. Gulkula provides local Yolngu employment, with training opportunities aimed at developing transferable skills among the workforce (Figure 75). Gulkula’s nursery is accredited by the Nursery Industry Accreditation Scheme Australia ((NIASA; NGIWA 2021) (Figure 76) and supports local training in land management skills, including seed collection, fumigation and propagation of native flora. This in turn supports progressive mine rehabilitation, whereby mined land is revegetated annually during the wet season. The main goal of mine rehabilitation at Gulkula is to re-establish self-sustaining native vegetation by propagating predominantly eucalypt savanna woodland species that support both traditional uses (i.e. bushfood, medicinal plants and timber) and habitat requirements of native fauna (i.e. food, shelter and resources). Gulkula’s land-clearing procedure does not permit the burning of native forest (as is the industry norm). Instead, it specifies the salvage of timber products for the local sawmill (also owned and operated by the Gumatj Corporation) before mulching forest residue, which in turn is used as growth media for progressive mine rehabilitation. In the mine closure phase, Gulkula intends to transition into broader natural resource management operations through active forest management in some mine rehabilitation areas. This will help sustain the local sawmill and timber industry while allowing Yolngu employees to use the skills they attained during mining activities. Gulkula is a demonstration of a sustainable mining model that marries environmental and cultural values while engaging Indigenous peoples in all aspects of mining operations. Figure 74 Knowledge sharing with Cape York Traditional Owners Expand View Figure 74 Knowledge sharing with Cape York Traditional Owners Photo: Tracy Menon Figure 75 Operating machinery (left) and assisting in dozer maintenance (right) at Gulkula Expand View Figure 75 Operating machinery (left) and assisting in dozer maintenance (right) at Gulkula Photos: left – Gulkula; right – Tracy Menon Figure 76 Propagating native plans for mine site rehabilitation at the Gulkula nursery Expand View Figure 76 Propagating native plans for mine site rehabilitation at the Gulkula nursery Photo: Tracy Menon Source: Jawun (2019) For more information, go toManagement of specific pressures Share on Twitter Share on Facebook Share on Linkedin Share this link
Expand View Figure 75 Operating machinery (left) and assisting in dozer maintenance (right) at Gulkula Photos: left – Gulkula; right – Tracy Menon
Expand View Figure 75 Operating machinery (left) and assisting in dozer maintenance (right) at Gulkula
Expand View Figure 76 Propagating native plans for mine site rehabilitation at the Gulkula nursery Photo: Tracy Menon
Tom Webster, Gillian Mayne and Pahia Cooper, Queensland Department of Environment and Science Building off the Australian Government’s Emissions Reduction Fund, the Queensland Government’s Land Restoration Fund (LRF) is expanding carbon-farming opportunities in the state by supporting projects that deliver carbon credits plus environmental, social, economic and Indigenous co-benefits (see Carbon) (see the Biodiversity and Indigenous chapters). By valuing and paying a premium for carbon projects with co-benefits, the LRF is supporting land managers, including farmers and Indigenous peoples, to generate new, regular income streams while improving Queensland’s environment and waterways, providing more habitat for threatened species and creating regional jobs. The LRF is underpinned by the LRF Co-benefits Standard (Land Restoration Fund 2020), which outlines how co-benefits from LRF projects are to be identified, measured, reported and verified. This standard, which is a market-leading innovation, ensures that co-benefits associated with carbon projects are evidence based. With climate change transforming the global economy and organisations increasingly becoming aware of their environmental impact, national and international organisations are looking to achieve their emissions reduction targets by purchasing carbon credits and investing in other emerging environmental markets. Queensland’s size and diverse natural environment means it is well positioned to build a robust carbon-farming industry able to meet the increasing demand for carbon credits. First projects up and running The LRF completed its first investment round in late 2020, contracting 18 projects across Queensland. The contracted projects represent a range of landholder sectors (12 agriculture, 4 Indigenous and 2 conservation), and were supported by partners such as Natural Resource Management groups; universities; conservation organisations; agronomists; and financial, legal and environmental advisors. Projects represent a range of project sizes and carbon methods (both below and above ground), and a diverse geographical spread. Investment outcomes include: influencing voluntary land-use change – more than 9,000 hectares (ha) of land contracted for carbon projects is classified as Category X, which is land that does not need a permit to clear under Queensland laws. This land will now have long-term protection from clearing and demonstrates the significant impact that investment in carbon projects with co-benefits can have in promoting voluntary action by land managers to retain and restore native vegetation reducing the risk of species loss, particularly from habitat loss, climate change and cumulative development impacts – 16 contracted projects will complete additional land management activities to protect threatened ecosystems, and 17 projects will result in more habitat for threatened wildlife. These projects combine existing carbon methods, such as restoring native woodlands and forests through regrowth or environmental plantings, with other on-ground activities, such as weed or pest control in relevant habitats supporting the health of Queensland’s wetlands – 8 contracted projects will restore wetlands through land management activities such as exclusion of livestock, direct planting and ongoing weed control improving catchment condition, including those flowing to the Great Barrier Reef – 8 contracted projects in Reef catchments will improve catchment condition through environmental plantings (over 1,700 ha) or regeneration of native vegetation (over 7,500 ha) improving the amount and condition of habitat available to threatened species and ecosystems – more than 600 ha of land will be rehabilitated and revegetated through contracted projects removing pest and weed species and replacing them with native trees (environmental plantings). Due to high up-front establishment costs, the environmental planting method has rarely been used under the Australian Government’s Emissions Reduction Fund framework, which favours lowest-cost abatement. The LRF paid a premium to contract 8 environmental planting projects because planting forest trees in highly modified agricultural areas makes the biggest change to the landscape and most clearly increases additional carbon sequestration driving new social and economic outcomes in Queensland – the LRF-contracted projects span 14 regional and rural Queensland local government areas. These projects are committed to sourcing goods and services from local businesses, training local workers, and using local manufacturers or other local businesses in the supply chain. Six projects are occurring on Indigenous land or have Indigenous participation supporting connection to Country – 2 savanna burning projects were contracted using an on-ground mosaic burning method (Figure 79). This method is culturally and environmentally beneficial because Traditional Owners are directly involved on-ground, allowing them to be more selective with burn areas so they can carefully monitor sensitive biodiversity needs. Although the costs of on-ground burning are higher, this method will produce better co-benefit outcomes. The LRF will continue to pursue a diverse portfolio of projects, ensuring that investments cover a range of locations, carbon methods, sizes and co-benefit outcomes with the aim of maximising the environmental, economic and social benefits that environmental markets can deliver in Queensland. Figure 79 On-ground mosaic control burn in savanna, a Land Restoration Fund project near Pormpuraaw, Cape York Expand View Figure 79 On-ground mosaic control burn in savanna, a Land Restoration Fund project near Pormpuraaw, Cape York Photo: © The State of Queensland (used with permission) For more information, go toResources Share on Twitter Share on Facebook Share on Linkedin Share this link
Expand View Figure 79 On-ground mosaic control burn in savanna, a Land Restoration Fund project near Pormpuraaw, Cape York Photo: © The State of Queensland (used with permission)
Expand View Figure 79 On-ground mosaic control burn in savanna, a Land Restoration Fund project near Pormpuraaw, Cape York
Graciela Metternicht, TERN, University of New South Wales; Ross Searle, TERN, CSIRO; Beryl Morris and Mark Grant, TERN, The University of Queensland Soil is both a natural resource and a public good that underpins wider sustainable development (Laban et al. 2018). Australia is fortunate to have a large amount of soil profile data observations and measurements publicly available through state and federal government agencies as well as some universities; a great example is eSPADE in New South Wales. However, these data are collected and managed by a broad range of custodians across the country, for their own specific business purposes and in disparate data systems. Researchers and practitioners interested in using these datasets have, in the past, had to integrate source data from individual custodians case by case. The SoilDataFederator is a novel Terrestrial Ecosystem Research Network (TERN) and CSIRO initiative to unify and serve data to users quickly and without preparation, with the data remaining managed by the individual custodians (Figure 80). The SoilDataFederator makes it relatively simple and efficient to develop programmatic workflows to interrogate and retrieve data from various unrelated data sources as needed. The web application programming interface (API) supports querying of data over the internet via a standardised set of uniform resource locators (URLs) with standardised parameters. Data can be returned in a range of formats optimised for delivery on a per attribute basis. The SoilDataFederator is part of the progression by TERN and CSIRO to enhance open access to soil data for Australia. It significantly eases access to soil data and enhances our ability to use these data for understanding and managing ecosystems. This national collaboration has enabled advances, for example, in mapping of soil thickness using a mix of traditional and novel machine-learning-based techniques (Malone & Searle 2020), 3-D modelling and mapping of soil properties (Kidd et al. 2020), refined mapping of Australia’s soil orders (Figure 81) (Searle 2021b, Searle 2021a), and many more. The TERN Soil and Landscape Grid of Australia (Grundy et al. 2015, Viscarra Rossel et al. 2015, Grundy et al. 2020) and the SoilDataFederator (TERN 2021) are essential pieces of national research infrastructure that can advance Australia’s National Soil Strategy and its vision of ensuring that Australia’s soil resources are sustainably managed for the benefit of our environment, economy, food and infrastructure security, health and biodiversity – now and into the future. TERN also collects field data of soil properties that contribute to the federated soil database (Figure 82). Figure 80 Conceptual diagram of the SoilDataFederator Expand View Figure 80 Conceptual diagram of the SoilDataFederator Source: TERN (2021) Figure 81 New digital soil map of Australia’s soil orders made possible using the SoilDataFederator Expand View Figure 81 New digital soil map of Australia’s soil orders made possible using the SoilDataFederator Sources: Searle (2021a), Searle (2021b); map projection: Australian Albers GDA94 (ICSM n.d.) Figure 82 Field data collection of soil properties is essential to the work of the TERN’s Surveillance and Landscape Observatories Expand View Figure 82 Field data collection of soil properties is essential to the work of the TERN’s Surveillance and Landscape Observatories Photos: Ben Sparrow and Mark Grant For more information, go toResources Share on Twitter Share on Facebook Share on Linkedin Share this link
Expand View Figure 81 New digital soil map of Australia’s soil orders made possible using the SoilDataFederator Sources: Searle (2021a), Searle (2021b); map projection: Australian Albers GDA94 (ICSM n.d.)
Expand View Figure 81 New digital soil map of Australia’s soil orders made possible using the SoilDataFederator
Expand View Figure 82 Field data collection of soil properties is essential to the work of the TERN’s Surveillance and Landscape Observatories Photos: Ben Sparrow and Mark Grant
Expand View Figure 82 Field data collection of soil properties is essential to the work of the TERN’s Surveillance and Landscape Observatories
Richard Lucas, Aberystwyth University, Wales; Graciela Metternicht, University of New South Wales; Norman Mueller, Geoscience Australia Many land-cover maps use the Food and Agriculture Organization (FAO) Land Cover Classification System (LCCS) (Gregorio et al. 2016) because this taxonomy provides a consistent, standardised classification (Owers et al. 2021) that can be applied at local to global scales. The FAO LCCS classes also broadly align with habitat taxonomies (Lucas et al. 2019). Previously, the land cover of continental Australia and islands was mapped using Geoscience Australia’s National Dynamic Land Cover Dataset (Lymburner et al. 2015, GA 2017a), based on 22 classes at 2-year intervals from 2000 using 250 metre (m) spatial resolution data from the MODIS (Moderate Resolution Imaging Spectroradiometer) satellite. However, following establishment of Digital Earth Australia (see case study: Digital Earth Australia: new technologies and partnerships to map Australia’s land), a new approach has been developed that allows annual land-cover maps to be constructed from environmental descriptors retrieved from timeseries of 30 m spatial resolution Landsat satellite data and according to the FAO LCCS. This development was undertaken through a collaborative partnership between Geoscience Australia, the Living Wales project of Aberystwyth University (UK), the University of New South Wales and Plymouth Marine Laboratory (UK). Maps have been made available for 2010 and 2015 (Figure 83); these years were selected to align with the accounting period of the National Land Account experimental estimates (2011–16) (ABS 2021e) (see case study: The National Land Account, experimental estimates (2011–16)), which also uses information on land use (ABARES 2021a) and land tenure (ABARES 2021b). As Digital Earth Australia holds the entire national archive (over 30 years) of satellite sensor data (GA 2020), there is future capacity to generate maps of land cover and also land-cover change for multiple years and time steps and for any spatial extent within Australia (e.g. by state, catchment, bioregion) (Lucas et al. 2019). By extending the collaboration to include the CSIRO, additional innovations such as the Australian Ecosystem Models Framework (Richards et al. 2020) and the Habitat Condition Assessment System (Williams et al. 2021b) (see case study: Assessing condition of habitat consistently and nationally) have been used to inform the development of pilot ecosystem accounts (see case study: Ecosystem accounting in a protected area). Australia aims to continue to report on many Sustainable Development Goal (SDG) targets (DFAT 2018b, DFAT 2018a). This new land-cover mapping for Australia provides a standardised system for estimating change, suitable for reporting on SDG targets (Metternicht et al. 2020, Owers et al. 2021). These include SDG targets 6.6.1 (change in the extent of water-related ecosystems over time), 11.3.1 (ratio of land consumption rate to population growth rate) and 15.3.1 (proportion of land that is degraded over total land area). Figure 83 (a) Digital Earth Australia land cover in Australia (2015), classified for use in the National Land Account. (b) Detail for Alligator Rivers, Kakadu National Park. (c) Detail for Gunbower-Koondrook-Perricoota Forest Icon Site Expand View Figure 83 (a) Digital Earth Australia land cover in Australia (2015), classified for use in the National Land Account. (b) Detail for Alligator Rivers, Kakadu National Park. (c) Detail for Gunbower-Koondrook-Perricoota Forest Icon Site Notes: Definitions of land cover classes are given in ABS (2021e). See case study: Ecosystem accounting in a protected area Sources: DEA land cover (Landsat) (2021); map projection: Australian Albers GDA94 (ICSM n.d.) For more information, go toResources Share on Twitter Share on Facebook Share on Linkedin Share this link
Expand View Figure 83 (a) Digital Earth Australia land cover in Australia (2015), classified for use in the National Land Account. (b) Detail for Alligator Rivers, Kakadu National Park. (c) Detail for Gunbower-Koondrook-Perricoota Forest Icon Site Notes: Definitions of land cover classes are given in ABS (2021e). See case study: Ecosystem accounting in a protected area Sources: DEA land cover (Landsat) (2021); map projection: Australian Albers GDA94 (ICSM n.d.)
Expand View Figure 83 (a) Digital Earth Australia land cover in Australia (2015), classified for use in the National Land Account. (b) Detail for Alligator Rivers, Kakadu National Park. (c) Detail for Gunbower-Koondrook-Perricoota Forest Icon Site
Alison Cowood and Terry Hills, Australian Government Department of Agriculture, Water and the Environment; Jonathon Khoo, Australian Bureau of Statistics The first National Land Account experimental estimates (2011–16) were released on the Australian Bureau of Statistics (ABS) website on 22 June 2021, with updates on 29 September 2021. The account is based on the 2010–11 and 2015–16 reference years (ABS 2021e), with future plans to develop an account to 2021 (ABS 2021b). The National Land Account is part of the ABS’s suite of environmental–economic accounts. It uses the United Nations System of Environmental–Economic Accounting framework, and is included as an activity under Australia’s collaborative national strategy and action plan for environmental–economic accounting (Interjurisdictional Environmental-Economic Accounting Steering Committee for the Meeting of Environment Ministers 2018). The National Land Account provides statistics to measure changes in land attributes over time, both from an economic and an environmental perspective. These attributes focus on land cover, land use, land tenure and unimproved land value (Figure 84). Data come from a range of sources, including: land cover from Digital Earth Australia, provided by Geoscience Australia (see case study: Applying the Land Cover Classification System to Australia for a nationally consistent land cover dataset) land use and tenure from the Australian Collaborative Land Use and Management Program, provided by the Australian Bureau of Agricultural and Resource Economics and Sciences (ABARES 2021a, ABARES 2021b) unimproved land value from the System of National Accounts, provided by the ABS (ABS 2020a). The National Land Account is an experimental account because it is testing the national application of an environmental–economic accounting approach to land for all of Australia for the first time. The methodology used to develop the data and compile the account has been updated from previous state- or regional-scale applications (e.g. Queensland; ABS 2017b). Some of the techniques used in the data development and compilation methods are still being refined (ABS 2021b). As a consequence, the publication is labelled as experimental while the methodology improves over time. The intention is to remove the experimental label in future releases. The ABS has previously produced state and regional environmental–economic accounts for land, including land in Queensland (ABS 2017b), Victoria (ABS 2012), South Australia (ABS 2015) and the Great Barrier Reef region (ABS 2014). These new national experimental estimates use a revised methodology and improved data sources. Comparison to previous releases is not advised. Figure 84 The 4 themes of the land accounts Expand View Figure 84 The 4 themes of the land accounts For more information, go toResources Share on Twitter Share on Facebook Share on Linkedin Share this link
Terry Hills and Dayani Gunawardana, Australian Government Department of Agriculture, Water and the Environment The Gunbower-Koondrook-Perricoota Forest Icon Site (GKP) is one of the first case studies for developing ecosystem accounts (DAWE et al. 2021) under the Strategy for a common national approach to environmental–economic accounting (see case study: Ocean accounting in Geographe Marine Park, in the Cumulative impacts management section in the Coasts chapter). The Department of Agriculture, Water and the Environment (DAWE) is leading the case study, in close partnership with the Murray–Darling Basin Authority, the CSIRO, GHD, IDEEA Group and Marsden Jacob Associates. Other national, state and local jurisdictional agencies, private sector entities and academia are involved in the partnership where relevant. GKP is located on the Murray River north-west of Echuca, and includes a national park and state forests. The entire icon site is a Ramsar-listed wetland, contains the second largest extent of river red gum forests in Australia, and is a nesting site for internationally protected migratory waterbirds. GKP is also one of 6 icon sites that are regularly monitored for ecological health under The Living Murray program (MDBA 2021). Account-ready data are available for GKP, covering ecosystem extent (Prober et al. 2021, Richards et al. 2021), ecosystem condition (Harwood et al. 2021a), biodiversity (Mokany et al. 2021) and the flow of ecosystem services and the benefits or value (monetary and non-monetary) these services provide (Figure 81). GKP provides recreational, tourist and cultural activities, as well as timber, pollination and honey, carbon sequestration, and water supply and water quality services to the regional economy. Scientists and accounting experts built on decades of international work (UNCEEA 2021) to further develop accounting methods that tailor, extend and more strongly couple existing recognised techniques and datasets, such as the Habitat Condition Assessment System (Williams et al. 2021b) for ecosystem condition (see case study: Assessing condition of habitat consistently and nationally); ‘BILBI’ (CSIRO 2021b) for biodiversity assessment; the Australian Ecosystem Models Framework (Richards et al. 2020) for a national ecosystem classification and conceptual models; and national land cover datasets from the experiment land accounts (ABS 2021e, ABS 2021b) (see case study: The National Land Account, experimental estimates (2011–16)). The approach taken is novel in explicitly recognising that ecosystems are dynamic and are subject to both human and natural disturbance drivers. The approach aims to distinguish changes due to human actions (e.g. different land management practices), versus changes due to natural variability (e.g. bushfires or drought). These methods are well suited to scaling nationally, and many of the datasets used already have national coverage. This supports the growing appetite for holistic and coherent national ecosystem accounts that meet a range of needs for government, business and the community. Building on the experiences under this case study, DAWE and CSIRO are working with the Australian Bureau of Statistics to explore the feasibility and utility of establishing a set of national ecosystem accounts. Figure 85 Ecosystem types identified in the Gunbower-Koondrook-Perricoota Forest Icon Site in 2015 (top), and reference and modified states in the ‘inland floodplain eucalypt forests and woodlands’ ecosystem type (bottom) showing the causes of transitions between states and how that impacted the flow of ecosystem services in a small timber coupe in 2015 Expand View Figure 85 Ecosystem types identified in the Gunbower-Koondrook-Perricoota Forest Icon Site in 2015 (top), and reference and modified states in the ‘inland floodplain eucalypt forests and woodlands’ ecosystem type (bottom) showing the causes of transitions between states and how that impacted the flow of ecosystem services in a small timber coupe in 2015 For more information, go toResources Share on Twitter Share on Facebook Share on Linkedin Share this link
Expand View Figure 85 Ecosystem types identified in the Gunbower-Koondrook-Perricoota Forest Icon Site in 2015 (top), and reference and modified states in the ‘inland floodplain eucalypt forests and woodlands’ ecosystem type (bottom) showing the causes of transitions between states and how that impacted the flow of ecosystem services in a small timber coupe in 2015